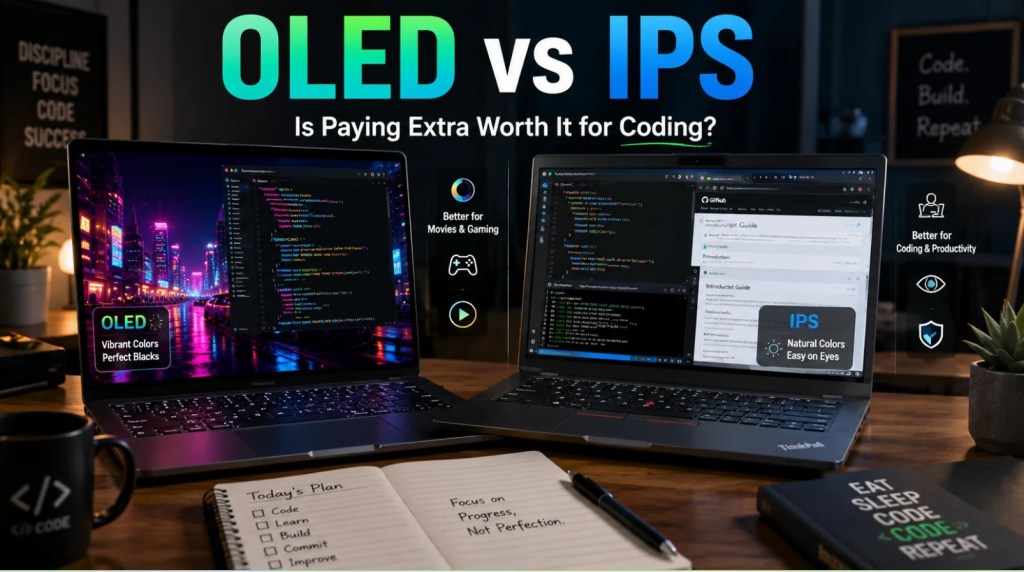
An Examination of the strategies for Effective Material Management in Building Construction Sites in Auchi, Estako Local Government, Edo State

https://doi.org/10.26643/ijr/2026/30

Daily writing prompt
How do significant life events or the passage of time influence your perspective on life?

Taiwo, N. B., Bert-Okonkwor, C. B. N., Mbadugha, L. C., & Fadumo, O. D. (2026). An Examination of the strategies for Effective Material Management in Building Construction Sites in Auchi, Estako Local Government, Edo State. International Journal of Research, 13(2), 22–38. https://doi.org/10.26643/ijr/2026/31

Nkechi Benedicta Taiwo1, Chiagozie Bertrand Nonso Bert-Okonkwor1, Lynda Chinwendu Mbadugha2 and Oluwatayomi Daniel Fadumo1

Affliation

1.Department of Building, Faculty of Environmental Sciences, Nnamdi Azikiwe University, Awka-Anambra State.

2.Department of Architecture , Faculty of Environmental Sciences, Nnamdi Azikiwe University, Awka- Anambra State.

Corresponding Author: taiwostical@gmail.com

Abstract

A lot of problems have been known to confront material management in building construction sites in Auchi, Estako local government, Edo state; one of the key issues is adoption of improper material management practices that don’t take care of material requirements, vendor evaluation, purchasing, handling, storage and site distribution. This study therefore examines strategies for effective material management in the study area with a view to enhancing successful project delivery. This study adopted a mixed survey design approach (quantitative survey) in accordance with the research objectives. The sampling techniques adopted for the study were multi-stage sampling for non-probabilistic samples, whereas purposive sampling was used to select the area (Auchi). Overall, the findings indicate moderate adoption of project-decided material management practices, with greater emphasis on conventional methods rather than modern-technology-driven approaches; Stock and Waste Control (3.91), Just-in-Time Method (JIT) (3.80), Warehousing Management (3.54) etc.are some of the existing practices. The study identifies the need for a formal material management system (3.39) as the most effective measure for improving material management on construction sites. This underscores the importance of structured and possibly digital systems for tracking, monitoring, and controlling materials. Other highly ranked measures include material scheduling for contractors (3.36), training of management and staff (3.34), and effective site supervision and administration (3.30). Overall, the study concludes that the right selection of appropriate material management practice is a fundamental aspect of successful building construction project execution. Poor management of materials leads to cost overruns, time delays, and reduced quality, while proper choice of management practices ensures smooth project flow, reduced wastage, and improved profitability. Based on these findings , the study recommends that the selection of a material management practice should be based on the merits of the selection, not just on familiarity. The findings emphasize systemic, managerial, and capacity-building solutions over isolated site-level controls.

Keywords: Material management, building construction sites, material management strategies, construction professionals, construction industry

1.0 Introduction

Building is a form of shelter, and its construction is an ancient human activity which evolved as the need for shelter became an important means of survival. (Ashiwini, 2023). Constructed shelters were the means by which human beings were able to adopt themselves to a wide variety of climates and other global species. However, Akadiri(2015), emphasizes that building construction is costly and requires huge resources to erect them. This factor has made building construction a Herculean task which has attracted the interest of professionals (e.g. builders, architects, civil engineers etc.) as the most effective means of managing building construction. Consequently, Tunji-Olayemi, Emetere and Afolabi (2017) state that to successfully erect a project, a number of issues arise as regards the material usage. The study further emphasizes the critical role that efficient material management plays in enhancing project performance and sustainability. Material management is a process that coordinates planning, assessing the requirements, sourcing, purchasing, transportation, storing and controlling materials, minimizing the wastage and optimizing the profitability by reducing the cost of materials (Chetna, 2011). The result of improper handling and managing material on site during a construction process will influence the total project cost, time and quality (Ashwini, 2013).  The problem of material management is one of the key issues facing construction sites in developing countries, as discovered by many researchers. Okolie, Ngwu, and Ezeokonkwo (2015) explain that the activities identified in the supply channel (the sourcing and transmission of purchase orders to control of material wastage) are considered key to material management because they primarily affect the economy, effectiveness of material movement, productivity, optimization of profit and reduction of material cost.  Presently, building materials are poorly managed in the study area, thereby resulting in a lot of abandoned building projects. The use of the traditional material management practice often takes care of material requirements, vendor evaluation and purchasing, while details of handling, storage and site distribution are left to be decided on site. There are other forms of material management systems that enable that material to be planned, ordered, delivered and handled while recognizing the cost associated with late ordering, wastage and poor handling facilities on construction sites in Auchi. Building professionals losses in productivity from the wrong choice of material management practice, which will eventually affect profit margins.

A lot of problems have been identified confronting effective material management; Okolie, Ngwu, and Ezeokonkwo (2015) explain that certain activities in the supply channel (the sourcing and transmission of purchase orders up to control of material wastage) often affect material management in terms of economy, material movement, productivity, profit and material cost. The study therefore recommends proper execution and control of standard materials delivered within time, budget and doesn’t compromise quality. The increasing cost of erecting a building as a result of poor material management practices during the construction process is worrisome. There is concern among building construction practitioners and professionals that the inherent dangers of poor management of materials in building construction affect the quality of building. (Kadiri, 2025). Most of the time, the contractor finds himself not meeting up with the budget because of lack of materials. The human cost is usually associated with a poorly delivered building and the cost of reconstruction and managing it is usually un_quantifiable. The challenges both have implications in building delivery and building management practices, which has prompted continuous research into their causes. Also, Akadiri (2015) study on understanding the barriers affecting the selection of sustainable materials in building projects only emphasized barriers that affect the selection of sustainable materials in building projects without highlighting the consequences of the use of such materials in both the project delivery and the safety of the project. This study therefore examines strategies to minimize these challenges and enhance effective material management practices on construction sites in Auchi. The research work is of immense benefit to future researchers and professionals in the field of building construction as a reference material for material management, and provides a cost-effective solution that ensures timely completion of projects and eliminates project abandonment.

2.0 LITERATURE REVIEW

2 1 Discussing Existing Material Management Practices in Building Construction

Effective management of materials contributes significantly to the success of the project. There are major issues which affect materials management activities, such as constraints on storage areas, site logistics with regard to materials handling and distribution, and also ordering and delivery of materials to the construction site. According to Canter (2009), material management practices are categorized into five processes, which are planning, procurement, logistics, handling and stock and waste control. Ocheoha (2013), also identify practices such as the just-in-time (JIT) method, Economies Order Quantity (EOQ), warehousing management, and recovery and recycling method as part of materials management practices that should be taken seriously, and these practices are detailed below:

1.  Planning practices: The process of planning construction methods has been defined as “understanding what has to be built, then establishing the right method, in the most economical way to meet the client’s requirements” (Barrie and Paulson,2010).  This is a detailed scheme for achieving an objective for certain work tasks. In the case of materials, there is a need for appropriate planning, which must be done concurrently with engineering, construction, and other project plans. He also mentions that material planning will provide guides for all the subsequent activities and could have a great impact on the project plan. The materials planning process covers setting up and maintaining the records of each part used in each plant to determine target inventory levels, and delivery frequency. As a result, excellent management of the materials record will help the flow of materials at the site in order to avoid several problems such as materials out of stock and materials that have not been delivered. Material planning would provide subsequent activities and could have a great impact on the project plan. The materials planning process covers setting up and maintaining the records of each part used in each plant to determine target inventory levels, and delivery frequency. As a result, excellent management of the materials record will help the flow of materials at the site in order to avoid several problems such as materials out of stock and materials that have not been delivered. Material planning would provide guides for all the subsequent activities and this could have a great impact on the project plan. The materials planning process covers the set-up and maintenance of records and determines the target inventory levels, and delivery frequency. Planning of access and routing of materials within a construction site has an important implication for the development of an effective materials management strategy (Waziri,2016), particularly in terms of increasing productivity and profit and facilitating the timely completion of construction projects. Planning and programming of work should include strategies, tactics, and tools for managing the design and construction delivery processes and for controlling key factors to ensure the client receives a facility that matches their expectations and function as it is intended to function. The requirement for efficient materials planning is to increase the productivity and profit of the company, and facilitate the completion of construction projects. Thus, better planning of raw materials on site can help to eliminate project delays and reduce activities.

2.Procurement processes: The term procurement encompasses a wide range of activities that includes purchasing of equipment, materials, labour and services required for construction and implementation of a project (Barrie and Paulson,2007). The objective of procurement in materials management is to provide quality materials at the right time and place, and at an agreed budget. Akbar Rasouli Kamran Behdinan and Salmon Farsi, (2016) state that procurement is about organizing the purchasing of materials and issuing delivery schedules to suppliers and following-up, to make sure that suppliers deliver on time. Canter (2009) states that failure in the purchasing process or in organizing buying functions results in:(a) over-ordering of materials (wastage problems);(b)Over-payments for materials (inadequate administration procedure);(c)Loss of benefits (lack of skilled negotiating procedures); and (d)Lack of knowledge (when and where the best service/source might be available at any particular time).

Purchasing in building construction involves obtaining all materials, equipment, and services needed to execute a project efficiently, on time, and within budget. It ensures that the right materials are delivered at the right quantity, quality, time, and cost, aligning with project specifications and construction schedules. The process involves (i)Identification of Material Needs from a work schedule or bill of quantities (BOQ) using a material requisition form. (ii)Approval of Material Requisition (iii) Supplier or Vendor Selection (iv)Request for Quotation (RFQ) (v)Quotation Evaluation and Negotiations(vi.) Issuance of Purchase Order (PO) (vii.)  Delivery and Inspection of Materials (viii)Storage and Record Keeping(ix) Invoice Verification and Payment(x)Supplier Performance Evaluation

┌────────────────────────┐

 │        Material Need                                     │

 │         Identified by Site                               │

 │        Engineer                                              │

 └──────────┬──────────────┘

 ┌──────────▼──────────────┐

 │        Requisition Approval                          │

 │         by Project Manager                           │

 └──────────┬──────────────┘

 ┌──────────▼──────────────┐

 │        Supplier Selection &                          │

 │        Request for Quotation                        │

 └──────────┬──────────────┘

 ┌──────────▼──────────────┐

 │        Evaluate & Negotiate                         │

 │        Quotations           │

 └──────────┬──────────────┘

 ┌──────────▼──────────────┐

 │        Issue Purchase Order                          │

 │        (PO) to Supplier                        │

 └──────────┬──────────────┘

 ┌──────────▼──────────────┐

 │                    Material Delivery &               │

 │                     Inspection at Site                   │

 └──────────┬──────────────┘

 ┌──────────▼──────────────┐

 │                     Storage & Record                   │

 │                    Keeping             │

 └──────────┬──────────────┘

 ┌──────────▼──────────────┐

 │                    Invoice Verification                │

 │                    Payment Processing                │

 └──────────┬──────────────┘

 ┌──────────▼──────────────┐

 │        Supplier Evaluation                            │

 │        for Future Projects                              │

 └─────────────────────────┘

Figure 2.1: Typical Purchasing Procedure in Building Construction

Source: Hohns (2017)

3.  Logistics: Logistics is a concept that emphasizes movement, and it encompasses planning, implementing, and controlling the flow and storage of all goods from raw materials to the finished product to meet customer requirements. Raw materials for construction are usually varied, bulky and heavy and require proper handling in the supply process. Consequently, the construction industry requires active movement of materials from the suppliers to the production area in both the factory and the work site. Experienced traffic personnel can have a positive impact on the execution of the project while minimizing transportation costs (Ahuja and Dozzi 2021). The primary focus of the logistics concept in construction projects is to improve coordination and communication between project participations during the design and construction phases, particularly in the materials flow control process (Agapiou etal., 2021). He also mentions that problems arise in the materials flow control process, which includes delays in material supply, due to some materials purchased just before they are required and waste of materials during storage, handling and transporting when procured in large quantities without complying with the production needs on site. Previous research suggested that the routing of materials is one of the main causes which affect cost and time during construction projects. Hence, the factors that should be taken into consideration during the logistics process for effective materials’ management include: optimum forecasting of materials movement (Mahdjoubi and Yang, 2001).

4.  Handling: Materials handling provides movement to ensure that materials are located and that a systematic approach is required in designing the system. Handling of materials is the flow component that provides for their movement and placement. The importance of appropriate handling of materials is highlighted by the fact that they are expensive and engage critical decisions. Due to the frequency of handling materials, there are quality considerations when designing a material handling system. The selection of the material handling equipment is an important function as it can enhance the production process, provide effective utilization of the workforce, increase production and improve system flexibility (Chan, 2002). The importance of appropriate handling of materials is highlighted by the fact that they are expensive and involve critical decisions. The material handling equipment selection is an important function in the design of a material handling system in order to enhance the production process, provide effective utilization of human power, increase production, and improve system flexibility. In addition, materials scheduling is also an essential part of handling materials on site, which has several benefits (Ezeh and Etodike, 2017), such as: showing the quantities involved in each particular operation; providing a key to the distribution of materials on site; and demonstrating useful way of checking quantities required by subcontractors, etc. Materials must be delivered to site undamaged and without any wastage. The most common problem associated with materials supply is inadequate unloading and handling facilities, which relates to a high proportion of wastage (Canter,2009). Therefore, handling with safety during movement of materials on site, which reduces the percentage of material wastage and finally fosters significant improvement, can often increase the total system productivity.

5. Stock and Waste Control: Delivery of the bulk of the construction materials requires proper management of the stock control. Stock control is a technique to ensure all items such as raw materials, processed materials, components for assembly, consumable stores, general stores, maintenance materials and spares, work in progress and finished products are available when required. Construction activity can generate an enormous amount of waste (Teo and Loosemore, 2001) and materials waste has been recognized as a major problem in the construction industry. They also mentioned that construction materials waste, in the USA contributes approximately 29%In the UK it contributes more than 50% and in Australia it contributes 20–30%. This is evidence to control construction materials in a good way during the construction process. The cause of waste in construction projects indicates that waste can arise at any stage of the construction process from inception, right through the design, construction and operation of the built facility. Therefore, waste can be reduced through the careful consideration of the need for minimization and better reuse of materials in both the design and construction phases (Dainty and Brooke, 2004). Material storage on site requires close attention in order to avoid waste, loss and any damage to materials which would affect the operations on the construction project. Problems often arise during materials supply because of improper storage and protection facilities. Previous studies have identified that building materials often require a large storage capacity which is rarely available on site (Agapiou et al., 2021).  There are a few considerations to be taken into account in the planning of the storage space, such as timing of the initial buy, and historical information and experience. Materials management on site should seek to reduce loss of profit due to theft, damage and wastage, as well as running out of stock. Therefore, the requirements for storage space should be taken into consideration from the initial stage of the construction process.

6. Just-In-Time Method (JIT): The acronym JIT has been highly visible since late 1980, as manufacturing attempted to meet competitive challenges by adopting newly emerging management theories and techniques, referred to as Lean production. Again, Just in Time (JIT) manufacturing is described as a system that helps in making an appropriate order of materials available to each operating unit at the right time in the right quantity. JIT is a systematic concept consisting of JIT purchasing, JIT transportation and JIT production. These three elements combine to create a material handling system that avoids waste and minimizes inventory investment. The technique has changed employees’ beliefs, attitudes, work habits and awareness of quality assurance. It is an operating management philosophy of continuous improvement in which non-value-adding activities (or waste) are identified and removed for the purposes of reducing cost. The objectives of JIT are to reduce processing time, eliminate waste, have respect for people and cost minimization and these can be achieved if this hold zero inventory; a system known as keen supply chain. The summary of the objectives of the supply chain-oriented organizations is to improve productivity by minimizing the cost of shady products. The following factors can be considered for the required improvements from Procom and product design, thing slate-of -the-art equipment and technology, holding zero inventories, reducing lead-time of supply of material, reducing batch size, using a pull production system, simplifying factory layout.

7. Economic Order Quantity (EOQ): This determines the amount of order that minimizes total variable costs required to order and hold inventory. The economic order quantity (BOQ) refers to the order size that will result in the lowest total of ordering and carrying costs for an item of inventory. If a firm places unnecessary orders, it will incur unneeded order costs. If a firm places too few orders, it must maintain large stocks of goods and will have excessive carrying costs. It is recommended that the assumptions of economic order quantity are to: deal with only one material whose demand is assumed to be completely predetermined and demand remains constant over a period of time; holding and ordering rented costs per unit remain constant during the period of one year, irrespective of the order quantity. No stock out is allowed and ordered materials arrive instantaneously and the lead time, which is the time between ordering and receiving goods, is instantaneous and is equal to 0, and all materials ordered are delivered.

8. Recovering and Recycling: Recycling is the process of collecting materials that are often considered trash and remanufactured tin for new products that can be resold or used again. Recovering simply refers to the process of retrieving the disposed or about to be disposed of and making it ready for recycling. That is, removal of materials from the solid waste stream for sale, use, or reuse as raw materials (Monczka, 2002).

9. Warehousing Management: Chee-Chen, 2009 opines that warehousing can be defined as a storage facility used for storing construction material and supplies. He continued by saying that it serves as a central location for receiving, storing and distributing materials needed for construction projects. All organizations have a minimum level of inventory they keep for future operation. Whether they operate JIT or a traditional delivery system where inventory is kept, it is typically referred to as a warehouse. Although, in many logistical arrangements, the role of a warehouse is more properly viewed as a switching facility as contrasted to a storage facility, i.e. effective distribution systems should be designed not to hold inventory for an excessive length of time, there are times when inventory storage is economical. In the same vein, warehouse management means effective and efficient storage and provision of required materials to ensure smooth operations. Decentralized warehousing permits materials to be stored in the right places to facilitate production operations and provide quality customer service. Decentralization of warehouses is a common practice of large organizations that have different plants and product lines scattered over the country. The importance of warehousing include: a reduction in transportation costs; warehousing and the associated inventory are added expenses, but they may be traded off at a lower cost realized if JIT transportation is adopted; achieving smooth production—warehousing to some levels of inventories make materials available at all time for production process, hence, it helps to avoid stock-out of materials; coordination of supply and demand-firms that experience highly seasonal production and sales most times have problem in coordinating supply with demand of materials, warehouse helps them to even out supply and demand of materials over a given period; enjoy quantity purchase discounts- availability of warehouse encourages bulk purchases at discounted prices and maintaining a reliable source of supply-companies that have where to store materials always purchase materials and have regular supplier(s).

2.2    Strategies for Effective Material Management in Building Construction Sites

Material management has been an issue of concern in the construction industry.40% of the time lost on site can be attributed to bad management, lack of materials when needed, poor identification of materials and inadequate storage. The need for an ineffective material planning system has become mandatory. Some companies have increased the efficiency of their activities in order to remain competitive and secure future work. Many other firms have reduced overheads and undertaken productivity improvement strategies. According to Okorocha (2013), Effective Material Management should focus on the system adopted for pricing materials issues which largely depend upon the nature of the material, the undertaking concerned and the circumstances which require to be taken into consideration. These areas might be taken care of: the Materials Schedule for the Contract on Hand, the Bill of Materials, Purchase Requisition, Purchasing of Materials, Issuing of Materials for Use, and Use of Material on Site. In order to achieve good materials’ management on building projects, Calistus (2013) opines that the following areas have to be taken very seriously, i.e. Training of management and other staff, inventory control of materials on site, ensuring proper planning, monitoring, control. Management, supervision and administration of sites, provision of adequate storage of materials, proper usage of materials, materials schedule for the contract on hand, provision and accessibility of site layout and attention to weather conditions. To achieve good materials’ management on a building project, Calistus (2013) opines that the following areas have to be taken very seriously: i.e. Training of management and other staff, inventory control of materials on site, ensuring proper planning, monitoring and control. Alwi, Hampson, and Mohammed (2009), recommend the following effective materials’ management of building projects, which includes: management, supervision and administration of sites, provision of adequate storage of materials, proper usage of materials, material schedule for the contract on hand, materials delivery, provision and accessible site layout, Attention to weather conditions.

1.         Training of Both Management and Other Staff: It is necessary to provide education and training to encourage and promote the benefit of reuse, recycling and reducing material consumption. However, cost savings for reuse to reduce material consumption are difficult to measure, in which the material can be used and reduce consumption several times. It is more effective to provide training and education among staff, and involve employees’ participation in implementing waste management. They pointed out that employees’ participation could only be effective with genuine support from management.

2. Inventory Control of Materials on Site: It involves taking note of the use and inventory of materials on site and recordings, i.e. the loading and off-loading, transit and handling of materials. It is recommended that arrangements be made for materials to arrive on time. When a construction material is delivered to a site, it should be checked for damage, quantity, quality and specification. It involves physical control of materials, preservation of stores, minimization of obsolescence and damage through timely disposal and efficient handling, maintenance of store records, proper location and stocking. Stores are also responsible for the physical verification of stocks and reconciling them with book figures. The inventory control covers aspects such as setting inventory levels, ABC analysis, fixing economical ordering quantities, setting safety stock levels, lead time analysis and reporting.

3. Ensuring Proper Planning, Monitoring and Control: Construction site management practice is the process of determining, analyzing, devising and organizing all resources necessary to undertake a construction project. It also includes monitoring and controlling the planned actions towards successful project delivery. Some of the specific activities include the production of a Gantt chart, network analysis, method statements, resource leveling, progress reports and exception reports. The core element of planning is the establishment of a program which reflects the planning process in relation to real-time. Construction planning is the total process of determining the method, sequence, labor, plant, and equipment required to undertake a building project. All but the simplest tasks require planning in order to be accomplished with the best utilization of time and resources.

4.  Management, Supervision and Administration of Sites: Supervision is the direction of people at work and management is the planning and control of the work process on a construction site. Supervisory, management and administration of site are gradually spread throughout the earth because it is a more efficient way of accomplishing work. All work requires the coordination of effort; this is accomplished by giving workers assigned tasks and assigned time in which they are to accomplish these tasks, but instruction is not enough. A clear, specific instruction on what is to be done, monitor the worker in the course of their efforts, Jimoh, (2012).  This is the arrangement on construction sites that lends to effective information dissemination and exchange. Information such as correspondence, minutes, labor allocations, payroll, progress reporting, notices or claims, instructions, drawing register and technical information flows among stakeholders, for processing and further actions during and after project construction.

5.    Provision of Adequate Storage of Materials: Kasim (2005), opines that material storage on site requires close attention in order to avoid waste, loss and any damage to materials which would affect the operation of the construction project. There must be a proper storage facility provided for materials on site. Some materials are usually not stored in sheds or locked-up buildings, and double handling of materials because of improper or indecision about the proper storage facility constitutes waste. Old stock must be available for use after fresh delivery is made, and these materials must be placed in such a way that damage will not be done to them by human activities or traffic on site. Bagged materials such as cement should be stored in a place that is free from moisture.

6 Proper Usage of Materials: The use of materials is the flow component that provides for their movement and placement. Material usage can be defined as the provision of proper handling techniques either manually or mechanically for the components held on site during the construction process. Adequate care must be taken to prevent wastage when working with materials on a construction project. The assembly or the installation process involves the practical incorporated into the project of materials, depending on the skills of the workers involved. Materials on the job site at times may have had a little defect due to poor storage or poor quality on the part of the manufacturer.

7 Materials Schedule for the Contractor Hand: It has been established that the preparation of a good materials schedule helps a long way in solving the problem of material handling on site. This is prepared at the contract stage of the building contract by an estimator and also by the contactor in order to know accurately how much material to mobilize the site. This entails accurately detailing the type, the size of materials and all other possible information regarding the required materials and the quantities and date on which they should be delivered. Materials schedules are valuable to the buyer for ordering and also to the site supervisor to ensure that materials, when delivered, are allocated or unloaded at or for the projects or building elements for which they are specified for ordered productivity. Project schedules should establish guidelines as to when and how the project should be executed, schedule requirements need to be communicated and properly managed throughout the entire project. The purpose of scheduling is to organize and allocate the resources, equipment and labour with the construction projects tasks over a set period of time.

8 Provision and Accessibility Site Layout: Construction site layout involves identifying, sizing, and placing temporary facilities within the boundaries of the construction site (Heap, 2007). These temporary facilities range from simple lay down areas to warehouses, fabrication shops, maintenance shops, batch plants, and residence facilities. Required temporary facilities and their areas are dependent on many factors including the project type, scale, design, location, and organization of construction work. A detailed planning of the site layout and location of temporary facilities can enable the management to make considerable improvement by minimizing travel time, waiting time, and increasing worker morale by showing a better and safer work environment.

9          Attention to Weather Conditions: According to Muhwezl (2012), severe weather conditions were ranked in the first positions at asthmas. Significant was teat tribute on projects in the respective categories, exposing materials to inclement weather such as steel bars which rust and may get damaged. Using research results conducted by (Wahab and Lawal, 2011). Adverse weather is considered one of the main factors causing delays and cost overruns on construction projects (Osama and Khaled,2002).

Literature Gap: There are still gaps in literature on existing material management practices specific to the study area and measures to manage the observed effects of poor material management practices in the study area and this is what this study filled.

3.0 Methodology

This work adopts a mixed survey design approach (quantitative and qualitative survey) in accordance with the research question and hypotheses. A combination of qualitative and quantitative survey was used to collect data related to the objectives of this research. These are data which were generated through questionnaire and direct observation. The population of this study is 401, which constitutes all site-based professionals like Quantity Surveyors, Builders and Architects in the study area, duly registered in Edo state with the relevant professional bodies.

Table 3:1 Total Population of the Study

No of Practicing Builders in Auchi148Source: NIOB Auchi  Branch
No of Practicing Quantity surveyors  In Auchi128Source: NIQS Auchi  Branch
No of Practicing Architects  in Auchi125Source NIA Auchi  Branch
TOTAL401 

     Source: NIOB, NIQS, NIA  Auchi Branch(2024)

The sample size of the study was 200 respondents using the Taro yamane formula was adopted out of the entire population of 401 practicing builders, practicing quantity surveyors, and practicing Architects all in Auchi (Table 3.1). The sampling techniques for the study were multi-stage sampling for non-probabilistic sample whereby purposive sampling was used to select the area (Auchi).

4.0 FINDINGS

4.1       Response Rate

 The sample size of the study was 200 respondents out of the entire population of 401 made up of practicing builders, practicing quantity surveyors, and practicing Architects all in Auchi (Table 3.1). The sampling techniques for the study were multi-stage sampling for a non-probabilistic sample whereby purposive sampling was used to select the area (Auchi). A total of 401 questionnaires were administered, 250 (62%) were retrieved while 200 (80%) were validly and returned. The high response rate recorded by the researcher could be attributed to the data collection procedures. For instance, the researcher pre-notified the potential participants for the survey, the researcher administered the questionnaire with the help of research assistants and follow-up calls were also made to clarify queries as well as to prompt the respondents to fill in the questionnaires.

4.2 Testing/Ranks of Variables

Question 1: What are the existing material management practices adopted by building construction companies in the study area?

Table: 4:1 Existing material management practices adopted by building construction companies in the study area   

A. Planning (Rank 1, Mean Score: 3.98, Std Dev: 1.07): Planning emerged as the most highly ranked practice among the respondents. With a mean score of 3.98, it indicates that most construction companies prioritize careful preparation and scheduling of materials before and during project execution. The relatively low standard deviation (1.07) suggests that respondents had a fairly consistent view regarding the importance of planning. Effective planning ensures that materials are available when needed, reducing delays and inefficiencies on construction sites.

B. Stock and Waste Control (Rank 2, Mean Score: 3.91, Std Dev: 1.41): The second-highest ranked practice is stock and waste control, highlighting that construction companies are conscious of minimizing wastage and maintaining optimal inventory levels. A mean score of 3.91 demonstrates that the companies recognize the financial and operational benefits of controlling stock and reducing material losses. The standard deviation of 1.41 indicates some variability in perception, possibly due to differences in company sizes or management systems.

C. Just-in-Time Method (JIT) (Rank 3, Mean Score: 3.80, Std Dev: 1.12): The Just-in-Time method, ranked third, reflects the adoption of modern material management techniques. By receiving materials only as they are needed, companies can reduce storage costs and the risk of overstocking. The mean score of 3.80 is high, suggesting moderate to strong implementation, while the relatively low standard deviation (1.12) indicates general agreement among respondents about its effectiveness.

D. Warehousing Management (Rank 4, Mean Score: 3.54, Std Dev: 1.16): Warehousing management ranks fourth, emphasizing the importance of organized storage systems for materials. Companies with proper warehousing practices ensure materials are safe, accessible, and well-documented. A mean of 3.54 indicates that while important, it is not as prioritized as planning or stock control. The standard deviation of 1.16 shows relatively consistent opinions across the sample.

E. Procurement (Rank 5, Mean Score: 3.44, Std Dev: 1.29): Procurement ranks sixth, showing that while acquiring materials is essential, it is slightly less emphasized compared to other practices. A mean score of 3.44 demonstrates that respondents acknowledge its importance but may face challenges such as supplier reliability or cost issues. The standard deviation (1.29) suggests a reasonable spread of opinions among respondents.

F. Economic Order Quantity (EOQ) (Rank 6, Mean Score: 3.39, Std Dev: 1.38): Economic Order Quantity, a quantitative approach to determine the optimal order size, is ranked fifth. This reflects moderate adoption among building companies. With a mean score of 3.39, EOQ is recognized as a useful tool for reducing costs and avoiding excess stock, but it may not be widely implemented due to technical or operational constraints. The standard deviation of 1.38 indicates moderate variability in understanding or application.

G. Logistics (Rank 7, Mean Score: 3.35, Std Dev: 1.60): Logistics is ranked seventh, which points to moderate implementation in material transportation and handling. The mean score of 3.35 indicates that construction companies recognize its role in timely delivery of materials, but the high standard deviation (1.60) suggests significant variation among companies, possibly reflecting differing levels of expertise or resource availability.

H Recovering and Recycling (Rank 8, Mean Score: 3.21, Std Dev: 1.43): Recovering and recycling practices are less emphasized, ranking eighth. A mean score of 3.21 shows that although some companies adopt sustainable practices, it is not yet mainstream. The standard deviation of 1.43 indicates a moderate level of disagreement among respondents, perhaps due to differing priorities or awareness levels about sustainability.

I.  Handling (Rank 9, Mean Score: 3.11, Std Dev: 1.44): Handling of materials is ranked tenth, indicating that it is given relatively lower priority. While proper handling is crucial for preventing damage and loss, it appears that companies may rely on other practices like planning and stock control to indirectly manage handling. The higher standard deviation (1.44) suggests differing views on its significance.

Research Question 2: Suggest and recommend effective measures for managing materials in building construction sites in the study area

Table: 4.2: Effective measures for managing materials in building construction sites in the study area        

S/NStatements54321SUMMEAN SCORESTDRANK
1Training of both management and staff44495438156993.3415.183rd
2Inventory control of material on site58343143346393.1911.025th
3Ensuring proper planning, monitoring and control42232470415552.7719.047th
4Management, supervision and administration of sites44465438186603.3013.564th
5Provision of adequate storage of materials3856178546393.1932.065th
6Proper usage of materials29175639595182.5917.811th
7Material schedule for the contractor hand63453515426723.3617.382nd
8Provision and accessibility site layout42202470445462.7319.858th
9Attention to weather conditions23603967116173.0823.786th
10Importance of material for a project33206550325222.6117.599th
11Need for a material management system66453215426783.3918.671st

Source: Field Survey, (2025)

  1. Need for a Material Management System (Rank 1st, Mean = 3.39, STD = 18.67): This measure received the highest rank, indicating that respondents perceive having a formal material management system as the most critical strategy for effective material management. A structured system ensures tracking of materials, reduces wastage, improves procurement efficiency, and helps in accountability. The relatively high standard deviation suggests some variability in responses, indicating that while most agree, there may be differences in how effectively such systems are implemented on site. Construction companies should adopt digital inventory and tracking systems to standardize material management.

B. Material Schedule for the Contractor Hand (Rank 2nd, Mean = 3.36, STD = 17.38): This measure scored highly, making it the second most important factor in effective material management. A material schedule ensures that contractors know precisely what materials are needed, when, and in what quantity, reducing wastage and delays. Its high mean score indicates strong consensus among respondents, while a moderate standard deviation shows some variability in opinions but overall agreement on its importance. Prioritizing proper material scheduling improves site efficiency and cost management.

C. D. Training of Both Management and Staff (Rank 3rd, Mean = 3.34, STD = 15.18): Training staff and management is critical for improving material handling, reducing errors, and enhancing project efficiency. The relatively high rank and mean score suggest that respondents see capacity building as a vital tool for effective material management. A lower STD reflects moderate agreement on its importance. Continuous training programs should be instituted to improve knowledge and skills related to materials handling.

D. Management, Supervision, and Administration of Sites (Rank 4th, Mean = 3.30, STD = 13.56): Effective supervision and administrative control on construction sites play a crucial role in ensuring that materials are used efficiently and according to plan. It ranked fourth, indicating its substantial but slightly lower perceived importance compared to scheduling and training. Adequate supervision ensures adherence to project schedules and material usage protocols, minimizing losses.

E. Inventory Control of Material on Site & Provision of Adequate Storage of Materials (Rank 5th, Mean = 3.19, STD = 11.02 & 32.06 respectively): Inventory control involves tracking materials from delivery to consumption, while storage provision ensures that materials are protected from damage and theft. Both measures scored equally in mean score but differed in standard deviation; storage showed high variability (STD = 32.06), indicating differing perceptions about its effectiveness. Maintaining proper inventory systems and storage facilities is important but may require site-specific adaptation.

F. Attention to Weather Conditions (Rank 6th, Mean = 3.08, STD = 23.78): Weather can significantly affect materials on-site, causing deterioration or damage if not managed properly. It was ranked moderately high, reflecting recognition of its role in protecting materials. The high STD indicates some disagreement among respondents, possibly due to variations in site locations or climate considerations. Construction sites should implement protective measures against adverse weather for sensitive materials.

F. Ensuring Proper Planning, Monitoring, and Control (Rank 7th, Mean = 2.77, STD = 19.04): Although planning, monitoring, and control are fundamental management practices, respondents ranked this relatively lower. This may suggest that while these practices are essential, their effectiveness in directly managing materials might be perceived as secondary to specific interventions like training or material scheduling. Strengthening site planning and control mechanisms will still benefit overall material management, but more tangible measures may take precedence.

G. Provision and Accessibility of Site Layout (Rank 8th, Mean = 2.73, STD = 19.85): An organized site layout facilitates smooth material flow and reduces handling losses. Its lower rank indicates that respondents may view layout accessibility as less critical compared to scheduling or training. Site layout optimization should complement other key material management strategies.

5.0 CONCLUSION

The descriptive statistics reveal that building construction companies in the study area predominantly rely on traditional material management practices, with planning emerging as the most widely adopted practice, contractors place strong emphasis on advanced preparation and scheduling of materials, as well as growing awareness of waste reduction and efficient inventory management. However, there is limited adoption of sustainable practices and weak institutional mechanisms for continuous improvement. Since poor management of materials leads to cost overruns, time delays, and reduced quality, there is a need for efficient management that ensures smooth project flow, reduced wastage, and improved profitability through “Waste Reduction and Recycling” as well as “Monitoring and Control Systems” recorded the lowest mean value

6.0 RECOMMENDATIONS

Based on the findings and conclusions of this research, the following recommendations are made:

1. Adopt Digital Material Management Systems: Construction firms should integrate modern digital tools and software such as ERP systems, bar-coding, and inventory tracking technologies to improve accuracy, transparency, and accountability in material handling.

2. Strengthen Planning and Scheduling: Proper planning and scheduling of material procurement and usage should be implemented before project commencement to prevent shortages, waste, and delays.

7.0 CONTRIBUTION TO KNOWLEDGE

This research has contributed to the body of knowledge by providing empirical evidence on the state of material management practices in Auchi, Etsako West Local Government Area, a region with limited prior academic documentation on this topic. It bridges the knowledge gap between theoretical material management frameworks and their practical application in rural and semi-urban Nigerian construction environments.

i) Acknowledgments

Special acknowledgment to everyone who made this study a success and to the Departments of Building, Nnamdi Azikiwe University, Awka Anambra State, for the support of data collection.

(II)Disclosure of Conflict of Interest

 Authors declare that there is no conflict of interest regarding the publication of this manuscript.

 (iii) Statement of Ethical Approval

All relevant ethical approval for this study has been obtained and maintained.

(iv) Statement of informed Consent

All necessary informed consent were obtained.

(v)Funding

This research received no external funding.

(Vi)Data Availability Statement

The original contributions presented in the study are included in the article, further inquiries can be directed to the corresponding author/s.

REFERENCES

Agapiou, A., et al. (2021). Materials flow control in construction: recent perspectives.

             [Publisher/journal unknown].

Ahuja, H., & Dozzi, S. (2021). Traffic personnel and transportation management in      

         construction projects. International Journal of Production Economics, 56(2),

         N121–133.

Akadiri, P. O. (2015). Understanding the barriers affecting the selection of

            sustainable materials in building projects. Journal of Building Research and

            Information, 43(1), 1–15.

Akbar Rasouli, A., Behdinan, K., & Farsi, S. (2016). Procurement organisation and

           delivery schedules in construction projects. Journal of Building Technology 7(3)

           567-671

Alwi, H., Hampson, K., & Mohammed, S. (1999). Effective materials management in

          building projects.

Ashwini,K. (2023). Construction project materials and cost management.

             International Journal of Construction Management, 8(2), 22–30

Barrie, D. S., & Paulson, B. L. (2007). Professional construction management (edition).

          Nigerian Journal of Construction Technology and Management, 10(1), 14–23.

Calistus, C. (2013). Measures for good materials management on building projects. [.

             International Journal of Project Management, 29(4), 403–408.

Canter, D. (2009). Materials management in construction: planning, procurement,

           logistics, handling, stock and waste control. Journal of Construction

          Engineering and Management, 135(7), 708–718.

Chan, E. (2002). Selection of material handling equipment and system design

        considerations. International Journal of Construction Engineering and

        Management, 1(1), 40–46

Chee Chen, C. (2009). Warehouse management and distribution in construction

         logistics. [. International Journal of Built Environment and Sustainability, 1(1),

         45–53.

Chetna, M. (2011). Material management in construction. International Journal of

            Engineering and Advanced Technology, 1(2), 25–32.

Dainty, A. R. J., & Brooke, R. (2004). Waste minimisation in construction: design and

          operational approaches. International Journal of Project Management, 14(1),

          37–45

Ezeh, S., & Etodike, F. (2017). Materials scheduling and distribution on construction

        sites. International Journal of Construction Research, 4(2), 71–84

Ghosh, A., & Jintanapakanont, J. (2024). Impact of materials management on.

           construction productivity and cost control. International Journal of

          Environmental Management, 17(3), 141–150.

Heap, [Initials]. (2007). Construction site layout and temporary facilities. [African

          Journal of Environmental Science and Technology, 5(3), 246–254.

Hohns, H. M. (2017). Typical purchasing procedure in building construction [Figure].

           [Source/publisher unknown].

Husnain-Arshad, M., & Jamaluddin, Z. (2017). Functions and practices of material

             management in the construction industry. International Journal of Civil

           ..Engineering and Technology, 8(9), 560–572.

Jimoh, A. (2012). Site administration and information flow on construction projects.

          Management science and management 6(4) 78-57

Kadiri, O. (2025). Impact of material shortage on building construction performance

           in Nigeria. Journal of Construction Management Studies, 10(2), 99–112.

Kasim, A., Anumba, C., & Dainty, A. (2005). Improper materials management and

             project performance. [Publisher/journal unknown].

Mahdjoubi, L., & Yang, Q. (2001). Forecasting material movement for construction

              logistics.

Monczka, R. (2002). Purchasing and supply chain management: recovering and

           …recycling materials.

Muhwezl, M. (2012). Weather impact on construction waste and schedule.

Ocheoha, T. (2013). Objectives and application of JIT in construction projects.

               [Publisher/journal unknown].

Okorocha, O. (2013). Materials pricing and issues control in construction.

Okolie, K. C., Ngwu, C., & Ezeokonkwo, J. (2015). Material management practices in

           the Nigerian construction industry: Challenges and prospects. Journal of

           Construction Engineering and Project Management, 5(3), 23–34.

Osama, S., & Khaled, T. (2002). Impact of weather on construction schedules. JOURNAL OF

Tunji-Olayemi, P., Emetere, M., & Afolabi, A. (2017). Effective material management

           for building construction projects. Journal of Sustainable Development in

           Africa, 19(4), 35–49.

Waziri, B. S. (2016). The role of material management in construction project delivery.

           Journal of Environmental Design and Construction, 12(3), 55–64.

Discipleship in the Bible: How Jesus Defined Spiritual Growth and Leadership

Daily writing prompt
How do significant life events or the passage of time influence your perspective on life?

Follow Me, Then Walk It Out

Jesus never recruited spectators. He called people out of boats, tax booths, and back alleys and put dust on their feet. Discipleship in the Bible begins with proximity: walking close enough to hear breath and see scars. Growth was not measured by information retained but by obedience practiced. Nets were dropped. Tables abandoned. Lives re-ordered around a voice that refused to stay theoretical. This was not a classroom. It was pavement and friction.

Formation Happens Under Pressure

Jesus shaped leaders by placing them where weakness surfaced. Hunger in the wilderness. Fear of open water. Failure in public. Scripture shows spiritual growth emerging under strain, not comfort. The call to follow carried cost, and that cost exposed what ruled the heart. Disciples learned prayer by watching Jesus withdraw exhausted. They learned courage by watching Him advance toward Jerusalem anyway. Leadership was formed where trust was tested. Growth hurt. That was the point.

A Different Kind of Authority

Jesus redefined leadership by emptying it of ego. Authority flowed downward through service, not upward through control. Feet were washed. Children were welcomed. The overlooked were centered. In this framework, the concept of discipleship refuses celebrity and embraces stewardship. Leaders were not trained to build platforms but to carry burdens. Influence came from faithfulness in small places. Power bent low. Strength looked like a sacrifice.

From Belief to Obedience

Biblical discipleship never stopped at confession. It moved toward action that cost something real. Teachings were meant to be practiced before they were explained. The understanding of what a disciple iscannot be separated from daily choices, how money is handled, words are spoken, anger restrained, and forgiveness extended. Faith showed up in kitchens, workplaces, and strained relationships. Truth lived there.
Right in the mess.

The Work Continues

The Mentoring Project exists for this exact terrain. It’s free Life Skills guides address more than 100 everyday struggles: conflict, fear, leadership fatigue, decision-making, stewardship, and endurance. These guides are built for lived faith, not shelf display. They are written to be read, listened to, and carried into ordinary pressure-filled moments.
Discipleship still walks.
Visit The Mentoring Project website to read or listen to the free Life Skills guides and take the next faithful step forward.

Factors Influencing Insufficient Facility and Management of Public Stadiums in Nigeria: An Overview

Daily writing prompt
Something on your “to-do list” that never gets done.

Akorede, S. N., & Obenda, M. I. (2026). Factors Influencing Insufficient Facility and Management of Public Stadiums in Nigeria: An Overview. International Journal of Research, 13(2), 1–10. https://doi.org/10.26643/ijr/2026/29

Seun N. Akorede, Moses I. Obenda

Department of Human Kinetics & Health Education, Faculty of Education, Ahmadu Bello University Zaria, Nigeria

Corresponding Author’s Email Id: t.omali@yahoo.com

Abstract

Stadiums serve as venues capable of uniting thousands of individuals, and fostering a remarkable architectural experience. Sadly, many of Nigeria’s public infrastructures including stadiums have significantly declined, highlighting the extent of neglect they have faced over time. The slow or irreversible decline of nearly all public facilities illustrates the degree of neglect they have experienced throughout the years. This research provides a review of the factors affecting inadequate management and maintenance of public stadiums in Nigeria. The secondary data utilized in this study comes from various published sources. The relevant material includes research articles sourced from credible electronic platforms. In addition to research articles, grey literatures were similarly referenced. The findings pinpoint political, economic, social, and technical issues that lead to substandard facilities and inadequate management in Nigeria’s public stadiums. Consequently, the review advocates for a thorough strategy that entails professionalizing management, reinforcing policy and accountability, diversifying funding sources and operations, along with implementing an organized, proactive maintenance plan (both preventive and scheduled).

Keywords: Deterioration, Facilities, Maintenance culture, Stadium, Sustained Maintenance

  1. Introduction

Public sports facilities primarily provide open areas for regular fitness activities. They highlight distinct public welfare traits [1] and currently serve as the foundation for healthy living in our nation. They also play critical role in government initiatives aimed at constructing a “sports superpower” [2]. Specifically, stadiums occupy a unique position within the cultural, economic, and social frameworks of nations, thus holding substantial significance [3]. Beyond hosting sporting events, stadiums function as places for shared experiences, economic catalysts, and identity centers. These sites not only accommodate football matches but also host major events like concerts, religious gatherings, and political rallies.

Investing in sports infrastructure involves substantial financial commitments and represents valuable national resources that convey an investment narrative. Nigeria’s increasing prominence in global football has largely been fueled by investments in football infrastructure alongside the achievements of its athletes in major European leagues. The country has heavily invested in the construction of stadiums [4]. Such expenditures aimed at showcasing modernization and attracting elite competitions have, at times, been influenced by political factors. Unfortunately, the rate of construction has outstripped effective management practices. Consequently, this situation calls for heightened managerial focus, which is vital for ensuring development. Investors, whether public or private, generally anticipate significant returns on their sports-related investments. So, effective management serves as a crucial element for maximizing returns on investment in sports infrastructure, highlighting the increasing importance of stadium management in many nations [5]. One of the key goals in facility management is to lower maintenance expenses while sustaining the quality of the services offered [6]. Management in the realm of sports infrastructure pertains to overseeing sports facilities.

Throughout various periods, Nigeria has hosted some of Africa’s premier sports stadiums. Currently, however, the nation lacks adequate operational stadium facility, a situation exacerbated by a severe absence of maintenance culture resulting from governmental negligence. Public infrastructure in Nigeria frequently suffers from inadequate upkeep [7], leading to their deterioration and resulting flaws at different levels. Although the upkeep of stadium amenities can be both expensive and complex, it is essential if any investment is to be justified. The decline of stadium infrastructure in Nigeria reflects deeper systemic issues that need to be identified and addressed. Among the country’s more than 40 stadiums, only around a dozen are deemed suitable for rehabilitation for international events. These include the National Stadium in Lagos, MKO Abiola Stadium in Abuja, Nnamdi Azikiwe Stadium in Enugu, U.J. Esuene Stadium in Calabar, Ahmadu Bello Stadium in Kaduna, and Liberation Stadium in Port Harcourt. Additionally, Abubakar Tafawa Balewa Stadium in Bauchi, Sam Ogbemudia Stadium in Benin, Liberty Stadium in Ibadan, Adamasingba Stadium in Ibadan, Teslim Balogun Stadium in Lagos, and Adokie Aimiesiamaka Stadium in Port Harcourt complete the list. Once a stunning venue when inaugurated in 1972, the Lagos National Stadium now represents a national embarrassment. The Godswill Akpabio Stadium in Uyo is regarded by Africa’s football governing body, CAF, and the world football governing body FIFA, as Nigeria’s sole international-standard facility, despite the existence of multiple multi-billion-naira venues built for international events. This underscores the country’s inadequate commitment to sports development. As a result, all the recent international football match involving Nigeria takes place at the stadium in Uyo. Thus, despite the numerous facilities distributed across the nation, Nigeria operates effectively as a one-stadium country, facing the risk of being prohibited from hosting international events if the Godswill Akpabio Stadium developed any issue.

It is noteworthy that modern tools have significant influence on facility management. For instance, the adoption of advanced technologies such as Geographic Information Systems (GIS) [8] is essential for resource management. GIS is commonly used for the collection, storage, alteration, analysis, visualization, and presentation of georeferenced data [9,10]. It enables the handling of spatially referenced data through manipulation, analysis, statistical applications, and modeling of spatial information [11, 12]. Recently, advancements in GIS, bolstered by big data technology, have found extensive application in geographic information mapping, as well as in the collection and analysis of spatial data. These technologies offer strong support for both theoretical and practical research concerning public sports facilities [13]. By leveraging the importance of GIS, integrating multi-source geographic data, and utilizing data integration techniques [14], it has become feasible to achieve an accurate spatial understanding of the supply and demand dynamics for public sports facilities through the development of an accessibility model that articulates the correlation between spatial supply and public sports facilities demand.

  • Materials and Methods

This paper presents an overview of factors influencing insufficient facility and management of public stadiums in Nigeria. The secondary data derived from various published document were used. Relevant materials used consisted of research articles availed from reputable electronic databases including Web of Science and Scopus. Apart from research articles, grey literatures were equally cited.

  • Results and Discussion
    • Political and Policy Influence on Public Stadiums in Nigeria

Public sports facilities are essential for ensuring that citizens can participate in sports [15]. They serve as a vital element of the public service framework aimed at promoting national fitness, acting as a crucial assurance for developing a robust sporting nation, and providing a fundamental platform and impetus for encouraging extensive fitness initiatives. In Nigeria, the construction of stadiums is often driven more by political motives, such as enhancing political reputation or the ambition to host significant mega-events, rather than by sustainable community needs or market demands [16]. This focus leads to a lack of consistency in management policies for these facilities and results in project neglect due to frequent governmental transitions.

By and large, effective execution of policies typically yields favorable outcomes. However, the implementation of such policies in Nigeria is notably poor. This adversely affects both the facilities and the management of public stadiums. Furthermore, policies may restrict potential income sources by forbidding commercial ventures (like restaurants or diverse retail options) on stadium grounds to focus exclusively on sports. Unfortunately, government involvement often introduces non-commercial objectives that compromise the long-term sustainability of these facilities. Another factor impairing the management and infrastructure of public stadiums in Nigeria is the prevalence of corruption. There is economic implications of corruption in construction [17] of stadium, often resulting in increased costs, inferior quality infrastructure, and enduring economic challenges. Moreover, the inventory management system in Nigeria is notably inadequate, which typically contributes to insufficient facility management of public stadiums. It is worthy of note that effective inventory management practices are crucial for maintaining lean inventories, creating robust policies for governance, and ensuring organizational efficiency [18]. However, ineffective inventory management can detrimentally affect an institution’s credibility and financial health. Lastly, there is a notable deficiency in a maintenance culture, which contributes to the inadequate management and upkeep of public stadiums in Nigeria. The lack of a proper maintenance culture and substandard facilities poses a serious challenge to football management. A maintenance culture implies the consistent and regular upkeep of buildings, machinery, facilities, and infrastructure to ensure they remain functional and in good condition.

  • Financial and Economic Factors on Public Stadiums in Nigeria.        

The role of sports infrastructure is crucial to the economy, especially in industrialized nations where sports have evolved into a significant economic sector, contributing roughly two percent to the gross domestic product (GDP) [19]. Funding greatly influences the strategies employed in the design and construction of stadiums. According to some experts, financial constraints have resulted in new sports grounds resembling industrial structures on the outskirts rather than grand football arenas. Furthermore, insufficient funding is a significant hurdle [20] for sports advancement in Nigeria. It’s essential that football venues are tailored to meet the needs of the sport, ensuring that vital elements such as the playing field, spectator stands, press areas, scoreboards, restrooms, ticket booths, dressing rooms, and accessibility are appropriately addressed.

In Nigeria, public infrastructure initiatives often falter due to insufficient funding [21] from government agencies or contractors. The policy requiring government Ministries, Departments, and Agencies (MDA) to return any unused allocated funds to the national treasury at the end of each fiscal year compounds this issue [22]. The Federal Government continually stresses that MDAs must remit any unspent amounts at the close of the financial year. As a result, MDAs tend to rush to return residual funds, striving to appear accountable, which inadvertently leads to project failures and stoppages. Furthermore, facility management receives low priority in Nigeria, with most resources allocated to initial construction rather than ongoing maintenance [23]. This is exacerbated by many public entities relying heavily on volatile government funding. Additionally, numerous investigations have indicated that corruption is a significant factor contributing to the dismal state of facilities, as maintenance budgets are often mismanaged or redirected [24]. Also, inflation impacts maintenance costs. Such macroeconomic fluctuations create serious obstacles for capital upkeep among businesses operating in the nation [25]. The influence of inflation on capital maintenance has grown increasingly important for financial reporting, investment choices, and regulatory supervision. [26]

  • Management and Human Resource Deficiencies on Public Stadiums in Nigeria.             

Facility management entails the strategic planning, administration, coordination, and assessment of daily operations within a facility. It focuses on harmonizing processes inside an organization to sustain and enhance services that back its core functions. Responsibilities within this scope are diverse, covering aspects such as marketing the facility, advertising events, overseeing maintenance, and managing staffing decisions. Typically, a personal manager or personnel director, along with other staff members, oversees the operation of most sports facilities. Often, a significant portion of the management team lacks formal training in facility management or any specialized technical skills. Of course, appointments are sometimes made based on personal connections rather than qualifications, leading to ineffective management practices [27]. Inadequate training often results in improper handling and neglect of equipment, leading to rapid deterioration [28]. Many employees do not have the requisite knowledge to perform basic maintenance tasks or to identify issues at an early stage [29]. Furthermore, Oyewole et al. [30] stress the necessity of continuous professional development for staff to remain updated on the latest maintenance techniques and technological advances. Research conducted by Ojo et al. [31] indicates that the lack of consistent maintenance strategies not only affects the operational efficiency of institutions but also leads to equipment issues. Promoting a more proactive approach to maintenance can be achieved by setting clear maintenance standards that enhance employee awareness and accountability.

  • Design and Construction on Public Stadiums in Nigeria                    

Inadequate initial planning often neglects projected usage, anticipated population growth, and the total costs associated with maintenance over the lifespan of facilities. Many public stadiums in Nigeria exhibit flaws in design and construction. The gap between infrastructure delivery and its management is increasingly being highlighted in academic and policy conversations in Nigeria [32]. Furthermore, the use of substandard materials or design, coupled with non-durable construction materials and shortcuts taken due to insufficient supervision, can lead to degradation and a necessity for frequent repairs. Additionally, maintenance strategies are seldom integrated into the original design, as there exists a disconnect between the construction phase and facility management.

  • Conclusion and Future Scope

This paper examines the elements that contribute to the inadequate facilities and management of public stadiums in Nigeria. The research revealed that the primary factors behind the poor conditions and governance of public stadiums in Nigeria stem from a multifaceted mix of systemic political interference, financial constraints, insufficient professional management skills, initial construction flaws, among other factors. A cycle of decline emerges when immediate political gains are prioritized over sustainable long-term operations (maintenance), ultimately imposing a burden on the public and hindering effective infrastructure utilization.

A holistic approach is essential to tackle Nigeria’s challenges regarding stadium management and facilities. It is crucial to implement strong policies and systems of accountability, which necessitates the introduction of rigorous assessment and oversight processes along with clear, standardized maintenance guidelines. Moreover, diversifying operational strategies by integrating professional management expertise and exploring varied funding options is vital. Encouraging private investment through public-private partnerships serves as another significant tactic. Additionally, a shift from a reactive approach—limited to “corrective repairs only”—to a well-organized, proactive maintenance strategy (encompassing preventive and planned measures) is imperative. Importantly, recruiting skilled and trained individuals, along with providing continuous training in facilities management departments, is paramount. Hiring should be based on expertise rather than favoritism.

References

  • Z. MeiY, & W. ZhengL, “Research on National Economic Evaluation of Large Public Sports Facility- Conceptual Framework and Evaluation Method,” J. Sports Res., Vol.5, p.6, 2008.
  • T. XueL, & Z. XiuH, “Investigation and Study of Residents’ Spatial Satisfaction of Public Sports Facilities in Urban Communities: Case Study of Guangzhou City (in Chinese),” J. Guangzhou Sport Univ., Vol.38, Issue 4, p.5 2018.
  • Della Spina, L. (2025). “Urban regeneration: Economic and social impacts of a multifunctional sports park in Reggio Calabria,” Buildings, Vol.15, Issue 3, p.466, 2025. https://doi.org/10.3390/buildings15030466
  • Ezeani, C. (2021). “Infrastructure Delivery and Facility Management Gaps in Nigerian Sports Facilities,” International Review for Policy and Development, Vol.6, Issue 2, pp.119–134
  • M. Megheirkouni, “Leadership Styles and Organizational Learning in UK For-Profit and Non-Profit Sports Organizations.” International Journal of Organizational Analysis, Vol.25 Issue 4, pp.596–612, 2017. doi: https://doi.org/10.1108/IJOA-07-2016-1042
  • A. Opoku, & J.Y. Lee, “The Future of Facilities Management: Managing Facilities for Sustainable Development.” Sustainability, 14, 1706, 2022.
  • S.S. Abdullah, A.H. Mohammad, & S. Misnah, “Analysis of the Determinant Factors, Development of Maintenance Culture in Malaysian Local Authorities,” MATEC Web of Conference. EDP Sciences, 1–8, 2014.
  • F.I. Okeke, & T.U. Omali, “Spatio-temporal Evaluation of Forest Reserves in the Eastern Region of Kogi State using Geospatial Technology,” Tropical Environment, Vol.13, Issue 1, pp.75–88, 2016.
  • T.U. Omali, “Review of Geospatial Information Technology for the Implementation of Financial Inclusion to Farmers. World Academics Journal of Management, Vol.9, Issue 4, pp.44–50, 2021.
  • T.U. Omali, “Correlation of Geographic Information System with the Evolutionary Theory of Spatial Analysis,” International Journal of Scientific Research in Computer Science and Engineering, Vol.10, Issue 4, pp.18–22, 2022.
  • T.U. Omali, “Time-series Analysis of Vegetation Cover in the Southwest Nigeria using Remote Sensing and GIS,” International Journal of Scientific Research in Multidisciplinary Studies, Vol.8, Issue 7, pp.36–42, 2023.
  • T.U. Omali, & K. Umoru, “A Survey of Remote Sensing and GIS Integration Method,” International Journal of Latest Technology in Engineering, Management & Applied Science, VII,pp.27–35, 2019.
  • S. Li, S. Dragicevic, F.A. Castro, M. Sester, S. Winter, A. Coltekin, et al. “Geospatial Big Data Handling Theory and Methods: A Review and Research Challenges,” ISPRS J. Photogramm Remote Sens., Vol.115, pp.119–133, 2016. https://doi.org/10.1016/j.isprsjprs.2015.10.012
  • X. Chen, W. Chen, B. Wu, H. Wu, & J. Xian, “Ship Visual Trajectory Exploitation via an Ensemble Instance Segmentation Framework,” Ocean Eng., Vol.313, 119368, 2024. https://doi.org/10.1016/j.oceaneng.2024.119368
  • W. Gao, W. Feng, Q. Xu, S. Lu, & K. Cao, “Barriers Associated with the Public use of Sports Facilities in China: A Qualitative Study,” BMC Public Health, Vol. 22. 2022. 10.1186/s12889-022-14441-w.
  • P.J. Inipami, & A.A. Nwala, “Facilities Management of Football Stadiums: It’s Implications and Customer Satisfaction,” International Journal of Business & Law Research, Vol.13, Issue 3, pp.266–274, 2025.
  • V.T. Nguyen, Q.T. Nguyen, T.T.D. Pham, & T.H.Q. To, “The Socio-Economic Impacts of Construction Corruption in Emerging Economies: A Case Study of Vietnam”. Proceedings of the Institution of Civil Engineers – Management, Procurement and Law, Vol. ahead-of-print No. ahead-of-print. 2025. https://doi.org/10.1680/jmapl.25.00021
  • I.O. Mbugi, & D. Lutego, “Effects of Inventory Control Management Systems on Organization Performance in Tanzania Manufacturing Industry—A Case Study of Food and Beverage Manufacturing Company in Mwanza City,” International Journal of Engineering, Business and Management, Vol.6, Issue 2), pp.56–69., 2022.
  • S.A. Tijani, A.O. Adeyemi, & O.J. Omotehinshe, “Lack of Maintenance Culture in Nigeria: The Bane of National Development,” Civil and Environmental Research, Vol.8, Issue 8, pp.23–30, 2016. 
  • F. Kermani, & S.T.A. Reandi, “Exploring the Funding Challenges Faced by Small NGOs: Perspectives from an Organization with Practical Experience of Working in Rural Malawi,” Res Rep Trop Med., Vol.1, Issue 14, pp.99–110, 2023. doi: 10.2147/RRTM.S424075. PMID: 37674662; PMCID: PMC10479561.
  • G.O. Nwankwo, & R.O. Ekechukwu, “Inadequate Funding and Substandard Facilities as Determinants of Risks Associated with Football Leagues in South-South Geo-Political Zone of Nigeria: Implications for Sports Counselling,” European Journal of Research and Reflection in Educational Sciences, Vol.5, Issue 1, 2017.
  • N. Nweze, “Failure of Public Infrastructure Projects in Nigeria: Causes, Effects and Solutions,” Texila International Journal of Management, Vol.2, Issue 2, 2016. DOI: 10.21522/TIJMG.2015.02.02.Art004
  • F.I. Emoh, C.C. Okechukwu, & E.I. Oladejo, “Facilities Management Impact on Public Organisations in Portharcourt, Rivers State, Nigeria,” British Journal of Environmental Sciences, Vol.9, Issue 6, pp.19–36, 2021.
  • Y. Manjo, “Maintenance Culture and the Challenges of Infrastructural Development in Nigeria: Implications for the Welfare of the Citizenry in the Fourth Republic,” Vol.1, Issue 2, pp.304–317, 2024.
  • National Bureau of Statistics (NBS). (2025). “Consumer Price Index Report, April 2025,” https://www.nigerianstat.gov.ng
  • O.S, Odutor, & V. Ehiedu, “Effect of Inflation on Capital Maintenance,” International Journal of Academic Information Systems Research Vol.9, Issue 6, pp.200–209, 2025.
  • C. Şeker, & D. Karadayi, “The Relationship Between Nepotism and Employee Performance,” Vol.9, pp.107–115, 2024. 10.5281/zenodo.14552806.
  • H. Musa, A. Umar, & I. Abdullahi, “Factors Affecting Maintenance of Office Equipment in Nigerian Universities,” International Journal of Engineering Research and Technology, Vol.14, Issue 8, pp.1123–1130, 2021.
  • A. Abubakar, S. Mohammed, & S. Gana, “Factors Influencing Maintenance Practices in Nigerian Universities,” Journal of Facilities Management, Vol.21, Issue 1, pp.34–46, 2023.
  • H.S. Oyewole, S.W. Kim, & J.K. Rhee, “An empirical study on Information Security Management,” Information Management & Computer Security, Vol.17, Issue 1, pp.15–28, 2020.
  • O. Ojo, A.I. Adeniran, & O. Adeyemi, “Strategies for Improving Maintenance Culture in Higher Education Institutions,” Higher Education Studies, Vol.12, Issue 2, pp.1–10, 2022.
  • A. Olotuah, & A. Taiwo, “Infrastructure Sustainability in Nigeria: The Missing Link Between Delivery and Management,” Journal of Sustainable Development in Africa, Vol.20, Issue 4, pp.112–126, 2018.

Professional HVAC Installation for Efficient and Comfortable Living

 Heating, ventilation, and air conditioning systems play a crucial role in maintaining comfort, health, and energy efficiency in residential, commercial, and industrial buildings. Hvac Installation is not simply about placing equipment and turning it on; it is a carefully planned process that directly affects indoor air quality, temperature control, energy consumption, and long-term operating costs. When installed correctly, an HVAC system provides consistent comfort throughout the year, regardless of external weather conditions.

One of the most important aspects of HVAC installation is system design. Every building is different, and factors such as size, layout, insulation levels, occupancy, and usage patterns must be considered before selecting equipment. Oversized systems may cool or heat spaces too quickly, leading to frequent cycling, uneven temperatures, and higher energy bills. Undersized systems, on the other hand, struggle to meet demand, resulting in discomfort and excessive wear. A professional assessment ensures the system is properly sized and suited to the specific needs of the property.

Energy efficiency is another key reason why proper HVAC installation matters. Modern HVAC systems are designed with advanced technology to reduce energy consumption while maximizing performance. However, even the most efficient unit can underperform if installed incorrectly. Poor duct connections, improper refrigerant levels, or incorrect airflow balancing can all reduce efficiency and increase operating costs. A well-executed installation ensures that the system runs at optimal efficiency, helping homeowners and businesses save on utility expenses over time.

Indoor air quality is closely tied to HVAC performance. During installation, attention must be given to ventilation, filtration, and humidity control. A properly installed HVAC system helps remove pollutants, allergens, and excess moisture from indoor air, creating a healthier living and working environment. This is particularly important for individuals with allergies, asthma, or other respiratory conditions. Good ventilation also helps prevent issues such as mold growth and stale air, which can negatively impact comfort and health.

The installation process itself involves several critical steps, including equipment placement, ductwork configuration, electrical connections, and system calibration. Ductwork must be sealed and insulated correctly to prevent air leaks that waste energy and reduce system effectiveness. Electrical components must meet safety standards, and controls such as thermostats need to be accurately programmed. After installation, thorough testing is essential to confirm that the system operates smoothly, delivers even airflow, and maintains desired temperatures.

Another important consideration is long-term reliability. Proper HVAC installation reduces the likelihood of frequent breakdowns and costly repairs. When components are installed according to manufacturer specifications, they experience less strain and wear, which extends the lifespan of the system. This not only protects the initial investment but also ensures consistent comfort for years to come. Routine maintenance becomes more effective when the system is installed correctly from the start.

HVAC installation is also closely linked to sustainability goals. Energy-efficient systems help reduce carbon emissions and support environmentally responsible building practices. Many modern installations incorporate smart controls, zoning systems, and high-efficiency heat pumps or air conditioners that adapt to usage patterns. These features allow users to fine-tune comfort levels while minimizing energy waste, making HVAC systems both eco-friendly and cost-effective.

For those seeking detailed guidance and professional insight into Hvac Installation, reliable resources can help explain the process, benefits, and best practices involved. Understanding installation standards and system options empowers property owners to make informed decisions and work effectively with professionals to achieve the best results.

Whether installing HVAC systems in new construction or replacing outdated equipment, professional installation is essential. It ensures compliance with regulations, optimizes performance, and enhances overall comfort. Attempting shortcuts or relying on improper installation can lead to inefficiencies, safety concerns, and unnecessary expenses.

In conclusion, HVAC installation is a foundational step in creating comfortable, healthy, and energy-efficient indoor environments. From system design and efficiency to air quality and long-term reliability, every aspect of installation matters. By prioritizing proper planning and expert execution, property owners can enjoy consistent comfort, lower energy costs, and peace of mind knowing their HVAC system is built to perform efficiently in all seasons.

5 Benefits of Turning Medical Data into Clear Patient Education Posters with AI Design

Hospitals and medical facilities are saturated with information, and yet the patient leaves the appointment unbelievably confused. The chart contains too much technical jargon; the pamphlet resembles an ancient text; and the artwork never matches the explanation the physician offers in the examination room. 

This explains why medical professionals are increasingly turning to AI generators like Dreamina to generate posters to illustrate medical information in a way that the patient can truly see and understand. 

Medical information stays noticeable as posters 

With AI-based design, even very detailed information like treatment procedures, medication timetables, and/or healing periods can be turned into nice, readable graphics. Rather than flooding them with words, you are providing them with something that only takes one quick look at, recall, and reference later. Dreamina simplifies the entire task of creating such graphics even for non-designers.

If patient education is visually appealing and easy to comprehend, patient trust will develop. And the result of patient trust is a willingness to comply, inquire, and self-manage.

Why medical visuals now mean so much

Patients are accustomed to being shown information in visual ways. They scroll, click, and zone in on things on a daily basis, so to step into an office where they are presented with a mass of words feels almost foreign to them. These posters blend icons, graphics, and simple design to meet the already existing needs of the patients.

Good visuals can also work as a means to combat anxiety. A poster that describes what happens during a procedure can calm nerves much better than a verbal explanation that goes on for a long time. Knowing what is going to happen can be less frightening than not knowing what’s going to happen.

Thus, many health care facilities have begun to move beyond general stock art to customized graphics made by artificial intelligence that serve their needs.

Benefit one: Clearer understanding in seconds

Good patient education poster communication occurs in a split second. Instead of reading three paragraphs about a disease, patients see it.

For example, one graphic might depict:

  • Where an organ is located
  • What part is affected
  • How the treatment works

In creating such a layout using Dreamina, you are, in fact, installing clarity within the layout. A person lacking health literacy can still go away with a newfound understanding of their condition from just this layout alone.

Benefit two: Content that matches real care

Stock photos tend to be too generic. They rarely correspond exactly to the procedure, device, or part of the body your patient has. Also, you can represent your practice in images that reflect your work on Dreamina.

This is where its AI image editor would prove to be very useful to you. Imagine you want a particular situation, and you can create an image of it, and then work on improving it until it suits your needs. This would ensure that there are no gaps between the language your doctors know and the pictures you hang on the wall.

Benefit three: Quicker updates regarding changing information

Medical standards evolve, treatment continues to advance, and clinics introduce new services. By the time posters are mass-produced, an upgraded version would be costly to produce.

“AI design reverses this process. When a protocol changes, you just have to alter the prompt and re-render the picture, and then you’re ready with a new poster to be distributed or printed,” he added. This ensures updated patient education without the need for frequent redesign.

Benefit four: Visually welcoming, not clinical

There is still a great deal of biomedical design that feels cold and frightening. Warm colors, pleasant characters, and clean design can make a big difference in how information is received.

Additionally, many of these come equipped with a design featuring a photo enhancer to brighten, sharpen, and soften the photo’s details, producing a warm, friendly poster rather than a cold one.

Benefit five: Easier sharing across spaces

The poster created by Dreamina does not necessarily have to be posted at one place only. The same image can be used on:

  • Waiting room screens
  • Clinic websites
  • Patient portals
  • Social media posts 

This ensures consistency, making it easier to reinforce messages and bringing patient education as part of the total care experience rather than something dispensed at the reception desk.

Dreamina’s health lab: Main medical facts made friendlier with visuals

Dreamina helps to integrate all of the above by allowing health professionals to easily create graphics online. There’s no need to have a design team when you can create professional-looking posters in no time. All you need are instructions and a few minutes of creativity spent with Dreamina.

Step 1: Create the text message

Open Dreamina and log in, and go to the central creative area and concentrate on creating your patient education poster prompt. Consider writing about the subject matter and the design aesthetics. 

A good example of what the prompt can be is: A straightforward patient education poster depicting the human heart and pointing out the blocked arteries and how the stent helps increase blood flow. 

This kind of specificity enables Dreamina to generate an accurate and soothing visual presentation. 

Step 2: Adjust parameters & generate

Select the model with good, precise, and clear illustrations, then set the aspect ratio based on where you intend to display the poster, whether it’s to be printed, displayed on a screen, or online. Select either 1k, which you can use for fast drafts, or 2k, which you can use for high-resolution printing. After everything is set, click on the icon of Dreamina to create your medical graphic. 

Step 3: Customize and save

In Dreamina, you can use the inpaint tool to work on areas of the poster and make them clearer. Other features include expand, to give the design more space, remove, to get rid of elements that are unnecessary, and retouch, to give it a smooth look. Once you are satisfied with your poster and think it looks clear and professional, you can click on the Download icon to save and share with your patients. 

Making patient education more human

When medical information is communicated visually, it turns from intimidating to empowering. Patients can point to a poster, ask questions about what they see, and remember the explanation later at home. It is that connection between image and understanding that will make AI-powered design so valuable in healthcare.

Dreamina empowers clinics and educators with a means to transform raw data into information that people can understand. It is not meant to replace medical expertise but rather supplement it by making one’s communication much clearer and even kinder.

Conclusion by feeling healthy with Dreamina

Turning medical data into patient-friendly posters isn’t just design; it’s care. When people understand their health, they make better choices and feel more confident about treatment options. In Dreamina, with just a few touches, you can create visuals that educate, reassure, and guide someone without needing a full creative team.

As healthcare continues to move toward clearer communication and patient-centered experiences, tools like Dreamina make bringing knowledge to life easier. You can help patients see their health in a whole new way with one thoughtful poster at a time.

Prevalence and Determinants of Hepatitis B and C Infections among Adults in Rural Northern Nigeria: Evidence from Fufore Local Government Area Adamawa state

Daily writing prompt
What’s your favorite thing to cook?

Abdulrahman, M., Owusu, M. O., Anointed, D., Josiah, D. D., Mani, M., Muoghalu, F. E. F., & Peter, I. ode . ode . (2026). Prevalence and Determinants of Hepatitis B and C Infections among Adults in Rural Northern Nigeria: Evidence from Fufore Local Government Area Adamawa state. International Journal of Research, 13(1), 560–571. https://doi.org/10.26643/ijr/2026/27

Prevalence and Determinants of Hepatitis B and C Infections among Adults in Rural Northern Nigeria: Evidence from Fufore Local Government Area Adamawa state

Muhammad Abdulrahman1, Michael Oluyemi Owusu2, David Anointed1, Dennis Dibal Josiah3, Magaji Mani4, Fakunle Ebere Favour Muoghalu 5, Itua ode ode Peter 5

1 Faculty of Public Health Texila American University, Lot 2442, Plantation Providence, East Bank Demerara (EBD), Guyana, South America,

2Clinical Research Nurse, National Health Service (NHS), Queen Elizabeth Hospital, Mindelsohn way, Edgbaston Birmingham United Kingdom B15 2GW

3Principal Medical Officer Cottage Hospital Fufore

4Department of Nursing Science Specialist Hospital Yola, Adamawa State Nigeria.

5World Health Organization FCT Field Office, Plot 617/618 Diplomatic Drive, Central Area District, P.M.B. 2851, Garki, Abuja, Nigeria.

ABSTRACT

Background: Hepatitis B virus (HBV) and hepatitis C virus (HCV) infections remain major public health challenges in Nigeria, particularly in rural communities with limited access to prevention and screening services. This study determined the prevalence and determinants of HBV and HCV infections among adults in Fufore Local Government Area (LGA), Adamawa State, Nigeria.

Methods: A community-based cross-sectional study was conducted among 384 adults selected using a multistage sampling technique. Data were collected using an interviewer-administered structured questionnaire, and blood samples were tested for hepatitis B surface antigen (HBsAg) and hepatitis C antibody (anti-HCV) using rapid diagnostic test kits. Descriptive statistics were used to estimate prevalence. Chi-square tests assessed associations between independent variables and hepatitis infection. Multivariable logistic regression identified independent determinants of hepatitis infection, defined as positivity to either HBsAg or anti-HCV. Statistical significance was set at p < 0.05. Determinants were analyzed using a combined hepatitis infection outcome due to overlapping transmission risk factors.

Results: The mean age of participants was 34.8 ± 10.6 years. The prevalence of hepatitis B and hepatitis C infections was 17.2% and 11.7%, respectively, while 4.7% of participants had HBV–HCV co-infection. Overall, 33.6% of respondents tested positive for at least one hepatitis infection. Independent determinants of hepatitis infection included unprotected sexual intercourse (AOR = 2.41; 95% CI: 1.31–4.45), traditional unsafe invasive procedures (AOR = 2.13; 95% CI: 1.09–4.17), sharing of sharp objects (AOR = 2.56; 95% CI: 1.30–4.70), age 35–44 years (AOR = 1.89; 95% CI: 1.02–3.49), low educational level (AOR = 2.21; 95% CI: 1.08–4.53), and marital status (AOR = 1.73; 95% CI: 1.01–3.02).

Conclusion: The prevalence of hepatitis B and C infections among adults in Fufore LGA is high, indicating sustained transmission in this rural community. Behavioral and sociodemographic factors were significant determinants, underscoring the need for targeted screening, vaccination, and community-based risk-reduction interventions.

Keywords: Hepatitis B; Hepatitis C; prevalence; determinants; rural community; Nigeria.

INTRODUCTION

Background of the Study

Hepatitis B virus (HBV) and hepatitis C virus (HCV) infections remain major public health challenges globally, contributing substantially to liver-related morbidity and mortality. The World Health Organization (WHO) estimates that approximately 296 million people are living with chronic hepatitis B and 58 million with chronic hepatitis C worldwide, resulting in over 1.1 million deaths annually from complications such as cirrhosis and hepatocellular carcinoma (World Health Organization, 2023).

Sub-Saharan Africa bears a disproportionate share of the global hepatitis burden due to limited access to preventive services, suboptimal vaccination coverage, inadequate screening, and persistent high-risk behaviors (Olayinka et al., 2016). Nigeria is classified as a high-burden country for viral hepatitis, with a national hepatitis B prevalence estimated at approximately 8.1% and hepatitis C prevalence of about 2.2% in the general population (Tomas et al., 2021; Musa et al., 2022). However, evidence suggests that prevalence rates are often higher in rural and underserved communities, where healthcare access is limited and traditional practices involving non-sterile instruments remain common (Ndako et al., 2019).

Rural populations in northern Nigeria are particularly vulnerable to hepatitis transmission due to widespread engagement in unsafe traditional invasive procedures, sharing of sharp objects, and low awareness of transmission routes and preventive measures (Okonko et al., 2019). Anecdotal reports from local health facilities in Adamawa State indicate frequent detection of hepatitis B and C infections among adults seeking care, suggesting a potentially substantial but under-documented burden in rural communities.

Fufore Local Government Area (LGA) of Adamawa State is a predominantly rural setting characterized by farming and informal trading, with limited access to secondary and tertiary healthcare services. Despite the known risk profile of similar rural communities in northern Nigeria, there is a paucity of community-based epidemiological data on the prevalence and determinants of hepatitis B and C infections in Fufore LGA. Existing studies from Adamawa State and neighboring regions are largely facility-based or focused on specific subpopulations, limiting their generalizability to the wider adult population.

Addressing this gap is critical for informing targeted public health interventions, including hepatitis B vaccination scale-up, community-based screening, and culturally appropriate risk-reduction strategies. This study therefore assessed the prevalence and determinants of hepatitis B and C infections among adults in Fufore Local Government Area, Adamawa State, Nigeria.

Statement of the Problem

Despite global advancements in prevention and treatment, hepatitis B and C infections remain underdiagnosed, especially in rural communities in Nigeria (Musa et al., 2022). WHO identifies Nigeria as a high-burden country for HBV, with rural populations experiencing disproportionate risks due to widespread traditional invasive practices using non-sterile tools and inadequate access to healthcare services (WHO, 2023; Okwori et al., 2020).

In Fufore LGA, informal reports and field observations indicate potentially increasing prevalence of hepatitis infections among adults. High engagement in unsafe traditional invasive procedures, low awareness levels, and risky behaviors such as unprotected sex and unsafe sharing of sharp objects remain key contributors to transmission. However, there is limited local epidemiological data to guide evidence-based intervention strategies.
This study therefore, determined the prevalence and determinants of hepatitis B and C infections among adults in Fufore LGA to facilitate informed public health actions for prevention and control.

Significance of the Study

This study will provide community-based evidence on the burden and determinants of hepatitis B and C infections in Fufore LGA. The findings are expected to inform public health strategies, support planning and implementation of targeted screening and vaccination programs, and guide community-based educational interventions to reduce transmission (WHO, 2023). Policymakers, healthcare providers, and stakeholders will benefit from the results in designing context-specific interventions.

Scope of the Study

The study focuses on adults aged 18 years and above residing in selected wards (Beti, Gurin, Ribadu, and Fufore) of Fufore LGA. It assesses the prevalence of hepatitis B and C infections and examines sociodemographic and behavioral determinants associated with their transmission.

Objectives of the Study

General Objective

To determine the prevalence and determinants of hepatitis B and C infections among adults in Fufore Local Government Area, Adamawa State, Nigeria.

Specific Objectives

  1. To determine the prevalence of hepatitis B and hepatitis C infections among adults in Fufore Local Government Area.
  2. To identify behavioral risk factors associated with hepatitis B and C infections among adults in Fufore Local Government Area.
  3. To assess the association between selected sociodemographic characteristics and hepatitis B and C infections among adults in Fufore Local Government Area.

Research Questions

  1. What is the prevalence of hepatitis B and hepatitis C infections among adults in Fufore Local Government Area?
  2. Which behavioral risk factors are associated with hepatitis B and C infections among adults in Fufore Local Government Area?
  3. What sociodemographic factors are associated with hepatitis B and C infections among adults in Fufore Local Government Area?

Research Hypotheses

Null Hypotheses (H₀)

  • H₀₁: There is no significant association between behavioral risk factors (unprotected sexual intercourse, sharing of sharp objects, and traditional unsafe invasive procedures) and hepatitis B and C infections among adults in Fufore Local Government Area.
  • H₀₂: There is no significant association between sociodemographic characteristics (age, sex, marital status, and educational level) and hepatitis B and C infections among adults in Fufore Local Government Area.

Alternative Hypotheses (H₁)

  • H₁₁: Behavioral risk factors (unprotected sexual intercourse, sharing of sharp objects, and traditional unsafe invasive procedures) are significantly associated with hepatitis B and C infections among adults in Fufore Local Government Area.
  • H₁₂: Sociodemographic characteristics (age, sex, marital status, and educational level) are significantly associated with hepatitis B and C infections among adults in Fufore Local Government Area.

Operational Definition of Terms

  • Burden: The prevalence of hepatitis B and C infections within the study population.
  • Determinants: Sociodemographic and behavioral factors contributing to hepatitis transmission.
  • Risk Factors: Actions or practices, such as unprotected sex, sharing sharp objects, or undergoing unsafe traditional invasive procedures, that increase the likelihood of acquiring infection.

MATERIALS & METHODS

Study design and setting

A community-based cross-sectional study was conducted in Fufore Local Government Area (LGA), Adamawa State, Nigeria. Four wards (Beti, Gurin, Fufore and Ribadu) were included. The area is predominantly rural; most residents are farmers, traders and artisans and access to secondary and tertiary health services is limited.

Study population

The study population comprised adults aged 18 years and above who had lived in the selected wards for at least six months at the time of data collection. Individuals who were critically ill or who declined to participate were excluded.

Sample size determination

The minimum sample size for prevalence studies was calculated using Cochran’s formula for proportions:

n =

Where Z = 1.96 (for 95% confidence), p = estimated prevalence, and d = desired precision (0.05).

Using the locally estimated prevalence for hepatitis B from preliminary field data (p = 0.172), the initial sample size was:

n = ≈ 218

Because a multistage cluster sampling approach was used, the sample size was adjusted for cluster design using a design effect (DEFF). A conservative design effect of 1.6was applied to account for intra-cluster correlation and the multistage procedure:

n1 = n × DEFF = 218 ×1.6 ≈349

To allow for non-response and incomplete data, a 10% contingency was added:

n = n1× (1+0.10) = 349 × 1.10 ≈384

Thus, the final sample size for the study was set at 384 participants.

Sampling procedure

A multistage sampling technique was implemented:

Ward selection (stage 1): Four wards (Beti, Gurin, Fufore and Ribadu) were purposively selected based on accessibility and local representation of the LGA.

Community selection (stage 2): Two communities were randomly selected from each of the four wards, yielding eight communities in total.

Household selection (stage 3): In each selected community, a household listing or estimate was used to calculate a systematic sampling interval. The target within-community sample was 48 participants per community (384 ÷ 8). A random start between 1 and k was chosen and every kth household was visited until 48 eligible participants were recruited.

Respondent selection (stage 4): In households with more than one eligible adult (≥18 years), one respondent was chosen by simple random selection (ballot method).

The final allocation was therefore 48 participants from each of the eight selected communities (48 × 8 = 384).

Data collection instruments and procedures

A structured interviewer-administered questionnaire was used to collect data on sociodemographic characteristics, knowledge and awareness of hepatitis, and exposure to potential risk factors (including unprotected sex, sharing of sharp instruments, and traditional invasive procedures). The questionnaire was developed in English, translated into the local languages (Hausa/Fulfulde) and back-translated to ensure accuracy.

Trained data collectors read the information sheet and consent script to prospective participants and obtained verbal informed consent prior to interview and testing. After the interview, each consenting participant underwent on-site rapid diagnostic testing for hepatitis B surface antigen (HBsAg) and hepatitis C antibody (anti-HCV) using WHO-recommended rapid test kits. Tests were performed by trained personnel following the manufacturers’ instructions and standard infection-prevention procedures (gloves, single-use lancets, safe disposal of sharps, surface disinfection). Rapid diagnostic test kits with manufacturer-reported sensitivity and specificity >99% were used.

Participants who tested positive on rapid test were counselled and provided with referral information for clinical follow-up and confirmatory testing at health facilities. All test results and responses to the questionnaire were recorded on coded study forms to protect confidentiality.

Rapid diagnostic testing results for HBsAg and anti-HCV were later recoded to generate a binary outcome variable (hepatitis infection: yes/no) for regression analysis.

Data management and analysis

Completed questionnaires and test result forms were checked daily for completeness and consistency. Data were entered into a statistical package (SPSS v26) and cleaned prior to analysis.

  • Descriptive analysis: Frequencies, proportions and means (± SD) were used to summarize sociodemographic variables and prevalence estimates. Prevalence of hepatitis B and hepatitis C were reported as proportions with 95% confidence intervals.
  • Bivariate analysis: Associations between categorical exposures (risk factors) and hepatitis serostatus were assessed using chi-square tests. Continuous variables were compared using t-tests.
  • Multivariable analysis: For regression analysis, hepatitis infection was defined as positivity to either hepatitis B surface antigen (HBsAg) or hepatitis C antibody (anti-HCV). Participants who tested positive for both HBsAg and anti-HCV were classified as having HBV–HCV co-infection and were included as positive cases in the combined hepatitis infection outcome. Variables with p < 0.20 in bivariate analyses were included in multivariable logistic regression models to identify independent determinants of hepatitis infection. Adjusted odds ratios (AOR) and 95% confidence intervals (CI) were reported. Statistical significance was set at p < 0.05.

Quality assurance

Data collectors underwent a two-day training covering the study objectives, questionnaire administration, informed consent procedures, rapid test performance, and infection prevention. A pilot test was carried out in a neighbouring community (not included in the main study) to refine the questionnaire and procedures. Supervisors performed daily checks on completed forms and observed testing procedures to ensure protocol adherence.

RESULT

Socio-demographic Characteristics of Respondents

A total of 384 adults participated in the study. The mean age was 34.8 ± 10.6 years (range: 18–65). Most respondents were aged 25–44 years (56.5%), female (54.4%), and married (61.2%). About48.7% had primary education, while 16.1% had no formal education.

Table 1: Socio-demographic Characteristics of Adult Respondents in Fufore Local Government Area, Adamawa State, Nigeria (n = 384)

VariableFrequency (n)Percentage (%)
Age (years)
18–247720.1
25–3411028.6
35–4410727.9
≥459023.4
Mean age ± SD34.8 ± 10.6
Sex
Male17545.6
Female20954.4
Marital status
Single7820.3
Married23561.2
Divorced/Widowed7118.5
Education
No formal education6216.1
Primary18748.7
Secondary8923.2
Tertiary4612.0

Most respondents were within the active reproductive and economically productive age group (25–44 years), which aligns with previous studies reporting higher risk of viral hepatitis among adults due to increased exposure to behavioral risk factors (e.g., sexual activity and occupational hazards). A higher proportion of females may reflect improved healthcare-seeking behavior, similar to findings from hepatitis studies in Northern Nigeria. Lower educational attainment among nearly half of respondents may influence awareness and prevention practices relating to hepatitis. These sociodemographic patterns are consistent with findings from Gyamfi et al. (2020), who reported higher hepatitis vulnerability among adults aged 25–45 years, especially among married individuals and those with lower educational levels. Similarly, Musa et al. (2022) noted that lower education limits awareness of hepatitis prevention and contributes to increased infection risk.

Prevalence of Hepatitis B and C Infections

Of the 384 participants, 66 (17.2%) were positive for hepatitis B, 45 (11.7%) for hepatitis C, and 18 (4.7%)had co-infection.

Table 2: Prevalence of Hepatitis B, Hepatitis C, and HBV–HCV Co-infection among Adults in Fufore Local Government Area (n = 384)

Infection StatusFrequency (n)Percentage (%)
Hepatitis B positive6617.2
Hepatitis C positive4511.7
Co-infection (HBV + HCV)184.7
Negative25566.4

The observed HBV prevalence of 17.2% is higher than the national Nigerian average (~12%), suggesting a significant burden in this rural setting. The HCV prevalence (11.7%) is also elevated compared to sub-national reports (~7–9%), suggesting a high burden of infection in this rural community. The 4.7% co-infection rate highlights shared modes of transmission. Similar rural studies in Northeast Nigeria reported HBV prevalence between 14–18%, supporting these findings. The hepatitis B prevalence in this study (17.2%) aligns with findings by Agwale et al. (2018), who reported 16.8% among rural dwellers in Northern Nigeria. Similarly, the HCV prevalence (11.7%) is comparable to Musa et al. (2015), who found 10.5% in a related rural population. However, these figures are higher than the national estimate of HBV (8.1%) and HCV (2.2%) reported by Tomas et al. (2021), indicating a higher burden in underserved rural communities.

Distribution of Behavioral Risk Factors

Unprotected sex was the most common risk factor (59.6%), followed by unsafe traditional invasive procedures (56.5%) and sharp object sharing (50.5%).

Table 3: Distribution of Behavioral Risk Factors for Hepatitis Infection among Adults in Fufore Local Government Area (n = 384)

Risk FactorYes n (%)No n (%)
Unprotected sexual intercourse229 (59.6)155 (40.4)
Traditional unsafe invasive procedures217 (56.5)167 (43.5)
Sharing sharp objects (blades/needles)194 (50.5)190 (49.5)
Previous blood transfusion72 (18.8)312 (81.2)
History of STIs59 (15.4)325 (84.6)

High engagement in unprotected sexual intercourse and unsafe invasive procedures contributes significantly to viral hepatitis transmission. Traditional practices involving scarification and tribal markings remain prevalent in rural communities, corroborating findings from Northern Nigeria. Sharp object sharing is common due to low access to sterile instruments. These findings are comparable to those of Okonko et al. (2019), who identified unprotected sex and sharing of sharp objects as the primary transmission routes in rural Nigerian populations. Orji et al. (2013) also emphasized the role of cultural invasive practices such as scarification in driving hepatitis transmission among communities with limited access to modern healthcare.

Association between Selected Factors and Hepatitis Infection

Bivariate analysis using the chi-square test showed statistically significant associations between hepatitis infection and marital status (χ² = 6.15, p = 0.046), unprotected sexual intercourse (χ² = 6.80, p = 0.009), exposure to traditional unsafe invasive procedures (χ² = 5.12, p = 0.024), and sharing of sharp objects (χ² = 7.05, p = 0.008). Sociodemographic variables with incomplete cross-tabulated data were not included in the chi-square analysis but were assessed in the multivariable logistic regression model.

Table 4: Bivariate Association between Selected Behavioral Factors and Hepatitis Infection among Adults in Fufore Local Government Area (n = 384)

VariableHepatitis Positive n (%)Hepatitis Negative n (%)χ²p-value
Marital status6.150.046
Married48 (20.4)187 (79.6)
Others (single/divorced/widowed)18 (12.9)131 (87.1)
Unprotected sexual intercourse6.800.009
Yes46 (20.1)183 (79.9)
No20 (12.9)135 (87.1)
Traditional unsafe invasive procedures5.120.024
Yes41 (18.9)176 (81.1)
No25 (15.0)142 (85.0)
Sharing sharp objects7.050.008
Yes39 (20.1)155 (79.9)
No27 (14.2)163 (85.8)

Footnote: Hepatitis infection was defined as positivity to either hepatitis B surface antigen (HBsAg) or hepatitis C antibody (anti-HCV). Percentages are row percentages. Chi-square test was used to assess associations. Statistical significance was set at p < 0.05.

Multivariable Logistic Regression Analysis of Determinants of Hepatitis Infection

Because the study aimed to identify shared community-level determinants, HBV and HCV outcomes were combined into a single ‘hepatitis infection’ variable for regression analysiscdo

Table 5: Multivariable Logistic Regression Analysis of Determinants of Hepatitis Infection among Adults in Fufore Local Government Area, Adamawa State, Nigeria (n = 384)

DeterminantAOR95% CIp-valueInterpretation
Unprotected sex2.411.31–4.450.005Significant
Traditional unsafe procedures2.131.09–4.170.028Significant
Sharing sharp objects2.561.30–4.700.006Significant
Age (35–44 years)1.891.02–3.490.041Significant
Low education (none/primary)2.211.08–4.530.030Significant
Marital status (married)1.731.01–3.020.048Significant
Sex1.120.67–1.870.542Non-significant

Footnote: Hepatitis infection was defined as positivity to either hepatitis B surface antigen (HBsAg) or hepatitis C antibody (anti-HCV). Participants who tested positive for both HBsAg and anti-HCV were classified as having HBV–HCV co-infection and were included as positive cases in the regression model.  AOR = Adjusted Odds Ratio; CI= Confidence Interval.

Behavioral factors (unprotected sex, sharp instrument sharing, and unsafe traditional procedures) were independently associated with a two – to three-fold higher odds of hepatitis infection. Sociodemographic determinants such as middle-age, low education, and marriage also showed independent associations. These findings mirror similar studies across Sub-Saharan Africa that emphasize both cultural and behavioral drivers of transmission. These determinants are in line with observations by Ndako et al. (2019), who identified unsafe traditional procedures and low education as independent predictors of hepatitis infection. The increased risk among married adults supports findings from Abdou et al. (2020), which linked marital sexual exposure to higher viral hepatopathy rates due to low condom usage.

DISCUSSION

This study examined the prevalence and determinants of hepatitis B and C infections among adults in Fufore Local Government Area, Adamawa State, Nigeria. The findings demonstrate a substantial burden of hepatitis infection in this rural population, reinforcing concerns that viral hepatitis remains an under-recognized public health problem in underserved communities with limited access to preventive and screening services.

Bivariate Associations

Bivariate analysis using the chi-square test revealed significant associations between hepatitis infection and selected behavioral factors, including marital status, unprotected sexual intercourse, exposure to traditional unsafe invasive procedures, and sharing of sharp objects. These associations highlight the importance of behavioral and cultural practices in shaping hepatitis transmission dynamics in rural settings. Similar findings have been reported in previous Nigerian and sub-Saharan African studies, where unsafe sexual practices and informal invasive procedures contribute significantly to hepatitis transmission.

The observed association with marital status may reflect differences in sexual behavior patterns and cumulative exposure risks; however, this finding should be interpreted cautiously, as marital status may serve as a proxy for other unmeasured behavioral or social factors. Overall, the bivariate findings suggest sustained community transmission driven largely by preventable behavioral exposures.

Multivariable Analysis

Multivariable logistic regression identified independent predictors of hepatitis infection after adjusting for potential confounders. The persistence of behavioral risk factors as significant predictors in the adjusted model underscores their central role in ongoing hepatitis transmission within the study population. Unlike bivariate analysis, the regression model allowed for simultaneous assessment of sociodemographic and behavioral variables, providing a more robust understanding of factors independently associated with hepatitis infection.

Sociodemographic variables, including age and education level, were assessed in the regression model despite not being included in the chi-square analysis due to incomplete cross-tabulated data. Their inclusion in the multivariable analysis strengthens the validity of the findings by accounting for confounding influences that may not be evident in unadjusted comparisons.

Hepatitis B Virus (HBV)

The burden of hepatitis B infection observed in this study has important public health implications, particularly given the availability of an effective vaccine. The findings suggest gaps in hepatitis B vaccination coverage among adults in rural communities, where routine screening and catch-up vaccination programs are often limited. Continued exposure to unsafe sexual practices and invasive cultural procedures further increases the risk of HBV transmission. Strengthening hepatitis B vaccination strategies, including adult catch-up vaccination and improved access to screening services, is critical to reducing HBV-related morbidity in rural populations.

Hepatitis C Virus (HCV)

Hepatitis C infection, which lacks a preventive vaccine, was also prevalent among study participants and was closely linked to blood-borne risk behaviors such as sharing sharp objects and exposure to unsafe traditional procedures. These findings are consistent with the known transmission pathways of HCV and emphasize the need for enhanced screening and early detection strategies. Integrating routine HCV screening into primary healthcare services, particularly in rural and high-risk communities, is essential for timely diagnosis and linkage to care.

Public Health Implications

Overall, the findings suggest sustained community transmission of viral hepatitis in Fufore LGA, driven largely by modifiable behavioral and cultural practices. Targeted community-based health education, regulation of traditional invasive practices, expansion of hepatitis B vaccination coverage, and improved access to hepatitis C screening are critical interventions for reducing the burden of viral hepatitis in rural Nigerian communities.

CONCLUSION

This study demonstrates a high burden of hepatitis B and C infections among adults in rural Fufore Local Government Area, with infection strongly associated with behavioral and cultural risk practices. The findings highlight persistent gaps in hepatitis prevention services, particularly hepatitis B vaccination coverage and access to hepatitis C screening. Addressing unsafe traditional practices, strengthening behavioral risk reduction interventions, and scaling up hepatitis prevention and screening programs are urgently needed to reduce the burden of viral hepatitis in rural Nigeria.

Authors’ Contributions

Muhammad Abdulrahman conceived and designed the study, analyzed the data, and drafted the manuscript. Michael Oluyemi Owusu contributed to study design and critically reviewed the manuscript. David Anointed and Dennis Dibal Josiah supported data collection and field supervision. Magaji Mani provided technical public health input. Muoghalu Ebere Favour and Itua Ode Ode Peter contributed to data interpretation and manuscript revision. All authors reviewed and approved the final manuscript and accept responsibility for its content.

Conflict of Interest:The authors declare that they have no competing interests.

Source of Funding: None

REFERENCES

  1. Abdou, R., Hassane, M., Moussa, A., & Oumarou, H. (2020). Sexual behaviour, marital status and risk of viral hepatitis infection among adults in Sub-Saharan Africa. African Journal of Reproductive Health, 24(3), 102–111.
  2. Agwale, S. M., Tanimoto, L., Womack, C., & Watanabe, K. (2018). Prevalence of hepatitis B virus infection among rural populations in Northern Nigeria. Journal of Viral Hepatitis, 25(7), 785–792.
  3. Gyamfi, C., Agyeman, A. A., & Frempong, M. T. (2020). Sociodemographic determinants of viral hepatitis infection among adults in rural West Africa. BMC Public Health, 20(1), 1458–1466.
  4. Musa, B. M., Bussell, S., Borodo, M. M., Samaila, A. A., & Femi, O. L. (2015). Prevalence of hepatitis C virus infection in Nigeria, 2000–2013: A systematic review and meta-analysis. Nigerian Journal of Clinical Practice, 18(2), 163–172.
  5. Musa, B. M., Zubair, S. A., Samaila, A. A., & Borodo, M. M. (2022). Epidemiology of viral hepatitis in Nigeria: Burden, transmission dynamics and public health implications. Annals of African Medicine, 21(1), 1–9.
  6. Ndako, J. A., Onwuliri, E. A., & Agabi, Y. A. (2019). Risk factors associated with hepatitis B and C infections in rural Nigerian communities. Journal of Community Health, 44(4), 785–793.
  7. Okonko, I. O., Okerentugba, P. O., & Akinpelu, A. O. (2019). Transmission dynamics of hepatitis B and C viruses in rural Nigerian settings. African Health Sciences, 19(1), 1839–1848.
  8. Okwori, A. E. J., Sadiq, M. N., & Ngwai, Y. B. (2020). Traditional practices and the risk of blood-borne viral infections in rural Nigeria. Nigerian Medical Journal, 61(2), 67–74.
  9. Olayinka, A. T., Oyemakinde, A., Balogun, M. S., Ajudua, A., Nguku, P., Aderinola, M., & Nasidi, A. (2016). Seroprevalence of hepatitis B infection in Nigeria: A national survey. The American Journal of Tropical Medicine and Hygiene, 95(4), 902–907.
  10. Orji, M. O., Mba, N. C., & Ogbu, O. (2013). Cultural practices and risk of viral hepatitis transmission in rural African populations. Journal of Infection in Developing Countries, 7(6), 455–461.
  11. Tomas, J., Adekanle, O., & Adebayo, S. (2021). National prevalence of hepatitis B and C infections in Nigeria: A systematic review. Pan African Medical Journal, 38, 132–141.
  12. World Health Organization. (2023). Global hepatitis report 2023. World Health Organization.

Beyond the Dictionary: Why Specialized Translators for Ukraine are Vital for Global Brands

Daily writing prompt
What do you complain about the most?

The surge in international interest toward the Ukrainian market has created a unique linguistic challenge. As global organizations, NGOs, and tech giants scale their presence in the region, the reliance on generic machine translation or non-specialized linguists has proven to be a costly gamble. Today, the role of translators for Ukraine has evolved from simple text conversion to a sophisticated form of cultural and technical consultancy.

Navigating the Nuances of a Living Language

Ukrainian is currently undergoing a period of rapid linguistic evolution. New terminology is emerging in the fields of defense, digital governance, and law, while older, borrowed structures are being replaced by authentic local forms.

Why Contextual Expertise Matters

Standard translation often misses the mark because it ignores the specific professional environment of the target audience. Dedicated translators for Ukraine provide:

  • Sector-Specific Accuracy: Whether it is the ISO-compliant language of heavy industry or the dynamic “slang” of the IT sector.
  • Dialectal Sensitivity: Understanding the differences between formal Western-style business Ukrainian and the more colloquial variations used in central regions.
  • Tone of Voice Management: Adapting global brand identities to sound authoritative yet approachable to a local consumer.

The Technological Edge: Human-Centric Innovation

Modern translation is no longer a manual, pen-and-paper process. At Technolex, our linguists leverage advanced infrastructure to maintain quality at scale.

By utilizing Computer-Assisted Translation (CAT) tools, our experts can maintain massive terminology databases. This ensures that a specialized term used in a contract remains identical in a product manual, regardless of how much time has passed between projects. This consistency is what separates a world-class brand from a temporary market player.

Protecting Integrity Through Multi-Stage Review

The greatest risk in localization is the “silent error”—a mistranslation that is grammatically correct but factually wrong. To prevent this, professional translators for Ukraine operate within a strict “TEP” workflow:

  1. Translation: Drafted by a subject matter expert.
  2. Editing: A second linguist checks for technical accuracy and flow.
  3. Proofreading: A final polish to ensure zero formatting or spelling issues.

This rigorous structure is the only way to guarantee that your documentation meets the high standards of the Ukrainian regulatory environment. In a country that values precision and resilience, your choice of language partner is the strongest signal of your respect for the local market.

Design Without Designers: How Non-Creators Use Transparent Backgrounds to Look Like Pros

Design is no longer left for designers alone. Today, founders, marketers, and creators with zero formal training produce visuals that look polished and professional-and all too often, it starts with a transparent background maker.

Thanks to tools like Pippit, non-creators can instantly remove clutter, isolate the key subject, and create clean graphics for social posts, presentations, or brand assets. Instead of wrestling with complicated software, they focus on storytelling and layout, turning simple ideas into visuals that feel intentional, consistent, and ready to impress.

It’s not about knowing software. It’s about removing friction, starting with the background.

The confidence gap that non-designers don’t talk about

Those people who say, “I am not creative,” are not struggling to find ideas. They are struggling to feel confident with the execution. They understand what it is that they want to communicate, but they don’t know how to communicate it in a way that makes it seem like it was a deliberate act.

This ambivalence results in:

  • Overcrowded visuals
  • Using too many fonts and/or colors
  • Intuitive Design
  • Design that appears to be accidental, not planned

Taking out the background may be the first point in the process where non-designers feel control instead of confusion.

Why transparent visuals feel instantly professional

Clean cut-out changes perception. Where the background disappears, the subject gains clarity, focus, and flexibility. Even simple layouts start to feel designed.

Non-creators catch this shift out of the corner of their eye. The same image that felt amateur suddenly feels ready for:

  • A website hero
  • Social post
  • A slide
  • A promo graphic

That transformation gains momentum.

How beginners accidentally discover good design principles

Surprisingly, clear graphics teach the basics of design without design training. By elaborating on cutouts, nonspecialists naturally acquire a feel for:

  • Visual hierarchy, because the subject stands out.
  • Negative space, because there’s room to breathe.
  • Balance, because placement matters more than decoration.

They’re not learning theory; they’re learning by doing it.

The quiet power of not starting from scratch

One of the biggest design mistakes that beginners have is starting on a blank canvas. Transparent assets eliminate that fear.

When you’re starting with a clean subject, decisions feel lighter. You’re placing, not inventing. You’re adjusting rather than guessing.

That shift makes design feel approachable instead of intimidating.

Where transparency is situated within work processes

Non-creators don’t design for enjoyment—they design out of necessity. The insertion of transparent backgrounds has a natural place within real-world design projects.

  • The founders apply them to make pitch visuals.
  • They are used for social purposes and ads by marketers.
  • They are utilized for brand identity development.

Because assets are repeatable, the process multiplies as opposed to recycling every time.

When simplicity triumphs over decoration

Non-designers have had a major wake-up call learning that sometimes—and in graphic design it is often true—less is indeed more.

Clean visuals do not require much processing or text, and many teams opt to simplify visuals once they are reused or remove text from video clips so that the visual is versatile regardless of the context in which they will be used.

Instead, clarity is what is sought after.

What non-creators love most about transparent assets

“Transparent” visuals eliminate the element of guesswork. It’s easier, in effect, to produce what feels right without being able to say why.

Non-designers usually point to:

  • Faster turnaround time
  • Fewer Revision Cycles
  • More flexibility and ease of modification
  • Less Increasing confidence sharing pictures publicly

It is an attitude that can be contagious—it spurs experimentation.

How transparent backgrounds create a design gatekeeping silence

Conventional design tools presuppose expertise. Transparent background tools presuppose intent.

When non-creators can single out an object within seconds, they stop regarding design as an area of specialization but as communication itself. This kind of attitude is highly effective.

A transparent background creator does not offer training on typography and color concepts. The largest visual obstacle removed by it, however, is clutter.

Why “looking professional” isn’t about perfection

Professional visualizations aren’t foolproof–they are consistent, understandable, and deliberate. Opacity allows non-designers to accomplish the bare minimum without stress.

When visuals seem intentional, a change occurs in audience reactions. Trust is built. Engagement is enhanced. Credibility is established.

Without a degree in design.

Pippit makes visual confidence accessible

Pippit isn’t about making everyone a designer. It is about enabling individuals to communicate visual ideas with ease and confidence, rather than feeling limited or doubting any decision made.

Thanks to Pippit and the use of storyboarding tools like its AI storyboard generator, non-creators are starting to think in visual terms without having to learn design principles.

Pippit simplifies background removals and asset creation, allowing non-creators to easily express their story without being burdened by tooling.

It is this freedom that ensures all the outcomes appear professional.

Design without designers is the new normal

With the reduction in creative hurdles presented by AI tools, the distinction between the “designer” and the “non-designer” is increasingly blurred. What is now imperative is the clarity of the message rather than the skills involved.

One of the simplest methods of blurring that line, and one that, when crossed, proves impossible to turn back, is having transparent backgrounds.

Ready to create beautiful graphics without needing a professional designer? Check out Pippit and get designing with confidence – even if creativity has never been something that has been a part of your skill set!

Office Art Installation Guide: Safe Mounting Heights & Spacing

Daily writing prompt
Write about a few of your favorite family traditions.

Office wall art should look orderly and stay secure. This guide covers safe mounting heights, clean spacing, and hardware choices for an office canvas print setup that works in busy workspaces.

Plan the Layout First

Measure the wall and nearby furniture

Measure the wall, then note what sits under it: desks, credenzas, benches, or a reception counter. Check door swings and walk paths so artwork corners are not in the way.

Before you plan the final placement, identify the wall surface (drywall, brick, concrete, or glass partition) and confirm what your building allows. Many offices also have hidden cable runs and sensors. A quick scan with a stud finder and a look at building drawings can prevent drilling into something you should not touch.

Choose the right size for the wall

One larger piece often reads cleanly in a focused work zone. Longer walls can handle a set of two or three pieces when the gaps are consistent. A helpful sizing check is to keep the full artwork width around two-thirds to three-quarters of the furniture width below it.

For meeting rooms, hallways, and workstations, explore Office Canvas Prints and pick a size that matches the wall width and viewing distance. If people mainly view the wall while seated, keep the center slightly lower than a standing-height corridor.

Mock up before you drill

Tape paper templates to the wall and step back to where people will view the art. Adjust until the placement feels centered and straight next to furniture and lighting. For sets, label templates so you do not mix up the order when you start drilling.

Standard Mounting Heights That Work in Offices

Use the eye-level center rule

A solid starting point is to place the center of the artwork around 57–60 inches (145–152 cm) from the floor. Keep a similar center line across a room so walls feel organized.

Hang art above desks and credenzas

When artwork sits above furniture, keep the bottom edge about 6–10 inches (15–25 cm) above the top surface. If the furniture is tall, start closer to 6 inches so the art does not drift too high.

Reception areas and corridors

In reception areas, use the same center-height approach rather than pushing art upward for tall ceilings. In hallways, leave enough side clearance so bags and shoulders do not brush the edges.

Spacing Rules for Single Pieces and Groupings

Single piece spacing

Give a single office art print room from trim, corners, and shelving. If the wall has switches or thermostats, keep the art far enough away that the wall does not feel crowded.

Two- and three-piece sets

Keep gaps consistent. A 2–4 inch (5–10 cm) gap between canvases works well on office walls. Measure edge to edge and check the gap in more than one spot before tightening hardware.

To center a set, calculate the full width of the group (all pieces plus the gaps), then mark the midpoint on the wall. Work outward from that center mark. If you have a laser level, use it to keep the top edges aligned across the full group.

Gallery-style layouts

Pick one alignment system—top edges, bottom edges, or a shared center line—and follow it across the whole group. If you are mixing sizes, build from the center outward so the group stays centered.

Hardware Choices for Safe Installation

Studs, anchors, and weight limits

Use studs when you can, especially for heavier pieces. If studs are not available where you need them, choose heavy-duty anchors made for your wall type and follow the rated limits on the packaging. When in doubt, select hardware rated well above the artwork weight to allow a safety buffer.

Hanging methods that reduce shifting

Two-point hanging helps keep frames from tilting. For larger pieces, French cleats can hold the art flatter to the wall and reduce movement in busy areas. Small bumpers on the lower corners can also help keep frames steady.

Alternatives for offices that change layouts often

If your office refreshes walls regularly, a rail-and-cable system can reduce wall damage because you adjust hooks rather than drill new holes. This approach is common in hallways and reception zones where artwork is updated seasonally or for events.

Match art to client-facing spaces

For conference rooms and reception walls, themes like leadership, teamwork, and growth fit many workplaces. If you want pieces built around these ideas, browse Business Concept Canvas Prints and choose sizes that suit your room scale.

Lighting and Glare Checks

Check the wall with lights on and at different times of day. Windows and strong overhead fixtures can create glare. If needed, shift the art a little or adjust nearby lighting angles.

Tools and Materials You’ll Want Ready

  • Tape measure, pencil, and painter’s tape
  • Level (or a leveling app)
  • Stud finder
  • Drill/driver, screws, and wall anchors
  • Step stool or ladder approved for your workplace

Step-by-Step Office Art Installation Workflow

  1. Mark the center height. Lightly mark where the artwork center should sit.
  2. Measure the hanging offset. Measure from the top of the frame to the hook point on the back.
  3. Set hardware. Use studs when possible; otherwise install anchors rated for the weight.
  4. Hang and level. Hang the piece, level it, then tighten hardware and recheck.
  5. Verify clearance. Open nearby doors, roll a chair back, and confirm nothing catches the frame.

For grouped pieces, hang the center piece first (or the center line for a grid), then work outward. Step back to the normal viewing distance and confirm the gaps read evenly from that angle.

Quick Rules for Clean Placement

  • Keep the artwork center near 57–60 inches (145–152 cm) from the floor.
  • Above furniture, keep the bottom edge about 6–10 inches (15–25 cm) above the surface.
  • For sets, keep gaps consistent—2–4 inches (5–10 cm) is a practical range.
  • Use two hanging points for better stability in busy areas.

Where Office Wall Art Fits Best

Plan placement by zone. Reception areas often suit one larger piece behind the desk. Work zones can use office wall art near collaboration tables, for Office Walls in shared corridors, or for Home Office corners where the art becomes a clean backdrop for video calls. Hallways and entryways work best when you keep walking space clear, while lounge seating areas can handle wider pieces above the backrest as long as the bottom edge stays safely above head level.

Common Mistakes to Avoid

Hanging too high: Use the center-height rule, not the ceiling height.

Uneven gaps: Measure every gap and keep tape guides up until the last screw is set.

Under-rated hardware: Match anchors and screws to the wall type and the weight.

FAQs: Mounting Heights, Spacing, and Safety

1) What height should office wall art be hung?

Start with a center height of 57–60 inches (145–152 cm).

2) How high should I hang art above a desk or credenza?

Keep the bottom edge about 6–10 inches (15–25 cm) above the surface.

3) How much space should be between two canvases?

A 2–4 inch (5–10 cm) gap works well in most offices.

4) How do I space a three-piece set?

Use the same gap between each piece and center the full group on the wall.

5) Should I align by the top edge or the center line?

Pick one system and stick with it; a shared center line is often easiest for mixed sizes.

6) What is the safest way to hang a heavier frame on drywall?

Use studs when possible; otherwise use anchors rated for the weight and wall type.

7) Is wire hanging safe for offices?

It can be, but two-point hanging often stays steadier in busy areas.

8) What is a French cleat?

A two-part mount that holds artwork flat and secure, useful for larger pieces.

9) How do I keep frames from tilting?

Use two hooks when the frame allows it, and add bumpers on the lower corners.

10) How close can art be to a doorway?

Leave clearance for the door swing and foot traffic so edges are not bumped.

11) What if the wall is brick or concrete?

Use a masonry bit and anchors made for that surface, and confirm building rules first.

12) How do I avoid glare on office art?

Check reflections during the day and under office lighting, then adjust placement or light angles.

13) Should art be centered on the wall or on the furniture?

Above furniture, center to the furniture width; on a blank wall, center to the main sightline.

14) How do I hang art in a hallway?

Keep the center height consistent and leave enough side clearance for people to pass.

15) What is a fast way to plan a gallery wall?

Use paper templates, tape them up, and mark the hardware points through the paper.

Final Check

After installation, do a gentle tug test and recheck level. Consistent heights, even gaps, and the right hardware help office prints look neat and stay secure.

Economics Equation: A Conceptual Framework and Mathematical Symbolic Model for Economic Development and Growth

Daily writing prompt
What’s the thing you’re most scared to do? What would it take to get you to do it?

Mashrafi, M. (2026). Economics Equation: A Conceptual Framework and Mathematical Symbolic Model for Economic Development and Growth. Journal for Studies in Management and Planning, 12(1), 65–74. https://doi.org/10.26643/jsmap/2026/3

Mokhdum Mashrafi (Mehadi Laja)
Research Associate, Track2Training, India
Researcher from Bangladesh
Email: mehadilaja311@gmail.com

Abstract

This paper proposes a conceptual economic framework, titled Economics Equation–3, to explain how economies transition from low or medium development levels to stronger and sustainable growth trajectories. Drawing from economic systems theory, conceptual modeling, and symbolic mathematical reasoning, the model identifies and integrates key positive growth factors, market flow dynamics, and negative constraints into a unified symbolic structure. The framework considers the interaction between product characteristics, manpower, market accessibility, policy intervention, and temporal–spatial variation. The study aligns with existing literature emphasizing the role of conceptual frameworks in modern economics, mathematical modeling for growth, and evolutionary economic theory (Fusfeld, 1980; Debreu, 1984; Dopfer, 2005; Vasconcelos, 2013; Czerwinski, 2024). The resulting conceptual model is intended to support future empirical studies, economic policy analysis, business strategy formulation, and long-term development planning. The work remains theoretical and hypothesis-driven, highlighting the need for empirical validation in diverse economic contexts.

1. Introduction

Economic development has long been understood as a multidimensional and evolutionary process that extends beyond the influence of any single variable. Rather than emerging from isolated improvements in production, technology, or policy, development reflects a coordinated transformation involving structural, institutional, and market-based forces that interact across time and space. Classical economic thought emphasized capital accumulation, labor productivity, and technological progress as core growth determinants, while contemporary approaches increasingly highlight institutional quality, market integration, innovation dynamics, spatial inequalities, and global interdependencies as critical drivers of development outcomes. This conceptual transition from linear to systemic interpretations of economic change underscores the need for analytical models capable of capturing the complexity and interdependence inherent in real-world economic systems.

The role of theoretical and mathematical modeling in understanding growth phenomena has been well recognized in economic literature. Debreu (1984) famously argued that mathematics provides a language for economics that enables precise reasoning, formal abstraction, and analytical clarity. Through mathematical modeling, economists can represent structural relationships and investigate counterfactual scenarios in ways that narrative reasoning alone cannot achieve. In a similar vein, Petrakis (2020) emphasizes that economic growth and development theories benefit from interdisciplinary modeling approaches that combine economics with quantitative, geographical, behavioral, and institutional perspectives. These approaches demonstrate that conceptual and mathematical frameworks do not replace empirical economics but rather enhance its interpretive and predictive capabilities.

In parallel with formal mathematical modeling, conceptual frameworks have played an essential role in structuring economic inquiry. Conceptual frameworks help researchers identify relevant variables, establish theoretical boundaries, and define causal or systemic linkages. For example, Ghadim and Pannell (1999) used conceptual modeling to examine innovation adoption in agricultural contexts, illustrating how behavior, information, and perceived risk shape technology diffusion. Similarly, Ramkissoon (2015) applied a conceptual framework to understand cultural tourism development in African island economies, demonstrating that place-based authenticity, satisfaction, and attachment interact with economic outcomes. At the macroeconomic level, Fusfeld (1980) outlined the conceptual foundations of modern economics to explain how market structure, institutional change, and policy influence national and global economic systems. Together, these examples show that conceptual frameworks serve as bridges between theoretical abstraction and empirical analysis, fostering analytical clarity in complex problem spaces.

Mathematical modeling complements conceptual frameworks by introducing symbolic and computational precision. Vasconcelos (2013) demonstrated how symbolic and numerical models can be used to explore economic growth trajectories, revealing nonlinear patterns and dynamic behavior that traditional verbal models struggle to represent. Debreu (1989) further emphasized that mathematical expression enhances economic content by imposing logical structure, enabling comparison across models, and allowing results to be replicated or extended. The convergence of conceptual and mathematical modeling traditions therefore reflects an ongoing evolution in economics: from discipline-specific reasoning to systemic and interdisciplinary analysis.

It is within this intellectual environment that the present study introduces Economics Equation–3, a symbolic and conceptual model designed to address a central research question: “What policies, structural factors, and economic forces are necessary to transform an economy from low or medium levels to a strong and sustainable state?” While conventional growth theories isolate individual variables—such as capital, labor, or technology—the proposed framework focuses on dynamic interactions between growth-supporting conditions, market flow dynamics, and limiting constraints. This perspective is especially relevant because real economies rarely follow smooth linear trajectories; instead, they evolve through feedback loops, structural bottlenecks, policy shocks, and adaptive changes.

By identifying underlying economic drivers and constraints, the framework highlights how productive capacity, market accessibility, temporal variability, and policy design interact to shape development pathways. For example, workforce motivation, product purity, and domestic sales strength may contribute positively to economic performance, while logistical inefficiencies, demand volatility, and external shocks may offset these gains. The resulting economic outcome depends not merely on improving positive factors but on managing the interaction between enabling and limiting forces. This systems-oriented reasoning aligns with evolutionary and complexity-based economic perspectives that conceptualize economies as adaptive systems rather than mechanical machines (Dopfer, 2005). In evolutionary frameworks, development emerges through processes of variation, selection, and diffusion across firms, industries, and regions—implying that structural change, institutional adaptation, and feedback loops are central to sustainable growth.

Moreover, as economies globalize, market flows are increasingly shaped by spatial and temporal conditions. Consumer behavior varies across demographic segments; place influences logistics, market access, and resource distribution; and time captures seasonal, cyclical, and long-term shifts in demand and policy. Integrating these dimensions into conceptual modeling enables more realistic representations of economic transformation. The Economics Equation–3 framework incorporates these dynamics through its treatment of customers, place, and time as critical modifiers of market flow.

In summary, the Economics Equation–3 framework builds upon longstanding traditions in conceptual economics, mathematical modeling, and evolutionary development theory. It offers a structured approach for analyzing how economies transition from lower developmental stages toward stronger, more resilient states. While the model presented is conceptual and symbolic rather than empirical or predictive, it provides a foundation for future research, simulation, policy evaluation, and strategic planning. Rather than seeking to replace classical growth theories, the framework aims to complement them by emphasizing systemic interactions, constraint management, and adaptive economic dynamics.

2. Methods and Modeling Framework

Figure 1 illustrates the methodological framework employed in this study, outlining the sequential process of factor identification, system flow conceptualization, and symbolic performance modeling. The figure shows how positive growth drivers (A), market flow dynamics (F), and negative constraints (C) interact to influence economic outcomes.

Figure 1: Methodological Framework

2.1 Conceptual Factor Identification

The first methodological stage involved identifying key positive and negative economic factors influencing productivity, market flow, and performance. Drawing from conceptual economic literature and practical development considerations, the following factors were determined to be fundamental:

  • product quality and availability, convertible cost, utilization efficiency, demand, manpower and motivation, product purity, domestic and foreign sales ratings, transportation cost, seasonal popularity, temporal and spatial demand shifts, policy support, and contextual externalities.

These reflect broader economic categories such as production capacity, market access, and institutional capability—recognized in both classical and contemporary development theory (Weaver, 1993; Petrakis, 2020).

2.2 System Flow Conceptualization

The economic system is modeled as an interaction among:

  • A (+): positive growth factors,
  • Flow: market dynamics influenced by customer, place, and time,
  • C (−): negative constraints and risks.

This approach aligns with systemic frameworks in evolutionary economics and structural development theory (Dopfer, 2005). Symbolic operators (+, −, ×, %, #, !, /, &) were assigned meaning to represent growth amplification, constraints, multipliers, efficiencies, bottlenecks, shocks, allocations, and interdependencies.

2.3 Mathematical Symbolic Modeling

The economic performance of an entity (firm, sector, or nation) is expressed as:

where = time, = place/geography, = customer characteristics.
Positive factors and negative factors are defined as vectors, and flow represents market access modified by time, space, and demand.

This symbolic modeling approach reflects the broader movement of “mathematics serving economics” (Czerwinski, 2024) and Debreu’s mathematical mode of representing economic content (Debreu, 1984).

3. Results

Application of the proposed conceptual structure—Economics Equation–3—provides several meaningful results concerning the nature of economic development, the determinants of economic performance, and the strategic implications for policy and market actors. Although the framework remains theoretical, its symbolic and structural features yield clear insights into how economic growth unfolds within a dynamic environment influenced by productive forces, market flow, and negative constraints.

First, the model reveals that economic growth emerges from interaction rather than isolation. Traditional growth models often emphasize individual factors such as capital accumulation, labor force expansion, or technological advancement. However, the symbolic relationship expressed as demonstrates that a single improved variable—such as product quality, workforce motivation, or manufacturing efficiency—is insufficient to produce sustained gains unless accompanied by favorable conditions in the broader system. For example, high product quality cannot translate into economic strength without market access, competitive pricing, logistics, and policy stability. This systems-based observation aligns with the logic of structural and institutional economics, which argues that development is path-dependent and shaped by multiple interlocking dimensions rather than singular shocks or interventions. The model therefore highlights the importance of complementarity among factors: productivity gains must interact with domestic and international market flows, while policy must facilitate allocation of resources, protection of investment, and mitigation of market failures.

Second, the results indicate that temporal, spatial, and demographic variability significantly influence economic performance. In the model, the flow function is explicitly conditioned by time (seasonal cycles, short vs. long-run dynamics), place (local, national, or international markets), and customer characteristics (income level, demographic composition, cultural preference). This result resonates with empirical findings in regional and development economics, where performance varies across territories due to resource availability, infrastructure, institutional capacity, and demand heterogeneity. Weaver (1993) demonstrated that export performance and growth differ across national contexts depending on external demand, internal constraints, and structural preparedness, illustrating how geographical variation shapes economic trajectories. Similarly, demographic economics emphasizes that demand patterns shift with population age structure, income distribution, and consumption preferences, affecting the magnitude and elasticity of market flows. The framework underscores that economic systems are not temporally uniform or spatially homogeneous, meaning actors—whether firms or governments—must adapt strategies to evolving temporal market cycles, geographic constraints, and evolving consumer needs.

Third, the model demonstrates that negative constraints must be actively addressed because they exert downward pressure on growth momentum. The vector incorporates high costs, logistical inefficiencies, market risks, demand volatility, and external shocks—including inflation, financial crises, or geopolitical instability. These variables contribute to economic friction, reducing the effective output of positive growth drivers. Even if productive capacity and market demand expand, increases in costs, bottlenecks, or uncertainty can neutralize these gains. This result aligns with structural constraint theories in development economics, which argue that infrastructure gaps, institutional rigidities, and volatility impose ceilings on growth potential, particularly in developing economies. The symbolic subtraction term within the model emphasizes that constraints increase as a weighted function of contextual friction, implying the arithmetic of development includes both additive growth forces and subtractive obstacles. Therefore, economic improvement depends not only on amplifying positive forces but also on mitigating or eliminating persistent constraints.

Fourth, the model highlights that policy optimization significantly influences economic outcomes. The relationship between , , , and implies a strategic control problem: governments or institutional actors can maximize economic performance by increasing the magnitude of positive drivers , reducing constraints , and improving the efficiency of flow dynamics through better infrastructure, market access, and temporal coordination. Policy levers may include regulatory reforms, trade agreements, logistics development, workforce training, technology upgrading, institutional strengthening, and stabilization mechanisms against external shocks. The model therefore suggests that policy success derives not from isolated interventions but from coordinated optimization across multiple dimensions.

Collectively, these results reinforce the argument that economic development is a systemic outcome generated by interactions among growth forces, constraints, and adaptive flow dynamics. The symbolic structure of Economics Equation–3 offers a concise representation of these interactions and provides a foundation for analytical, empirical, and simulation-based extensions in future research.

The resulting model yields several structural insights:

  1. Economic growth emerges from interaction, not isolation: Improvement in a single variable (e.g., product quality) is insufficient without market access, policy support, and cost efficiency.
  2. Temporal, spatial, and demographic variability matter: Performance changes with seasons, geographic markets, and customer income levels—consistent with multi-dimensional growth studies (Weaver, 1993).
  3. Negative constraints must be addressed: High costs, logistical bottlenecks, risks, and shocks reduce growth momentum, aligning with structural constraint theories.
  4. Policy optimization influences outcomes: Equation terms imply governments can maximize by maximizing , minimizing , and optimizing .

4. Discussion

The results derived from the Economics Equation–3 framework reinforce the idea that economic development is neither linear nor deterministic, but rather emerges from the coordinated interaction of multiple components operating under dynamic conditions. This perspective aligns closely with evolutionary economic theory, which conceptualizes development as a cumulative process characterized by feedback loops, adaptive behavior, and structural change (Dopfer, 2005). Instead of examining isolated causal factors—such as capital, labor, or productivity—the model emphasizes that economic outcomes result from systemic relationships between enabling factors, market flow dynamics, and limiting constraints. This systems-oriented logic challenges traditional reductionist approaches and provides a more realistic representation of how real economies evolve over time.

A central insight from the framework is that strong economies emerge when positive forces (A) expand more rapidly than negative constraints (C), and when market flow (F) remains flexible and responsive to temporal, spatial, and demographic variation. In practical terms, this means that policy efforts aimed solely at enhancing production capacity or improving product quality will not achieve optimal results if logistical bottlenecks, demand volatility, or external shocks remain unaddressed. Conversely, reducing structural constraints without investing in productive capacity will also fail to generate meaningful growth. The model therefore supports an integrated development strategy that simultaneously strengthens productive assets, minimizes constraints, and improves market connectivity.

The incorporation of time, place, and customer characteristics into the flow function reflects an interdisciplinary understanding of economic performance. Time introduces economic cycles, seasonal effects, and long-term transition paths; place introduces spatial heterogeneity, infrastructure differences, and global integration; and customer characteristics introduce preferences, purchasing power, and social stratification. Recognizing these dimensions extends the model beyond traditional macroeconomic abstractions and aligns it with contemporary development literature that emphasizes contextual variability and market segmentation (Petrakis, 2020). Such an approach also holds relevance for firms and industries operating in competitive markets where adaptation to consumer behavior and geographic conditions is essential for survival and growth.

The symbolic and mathematical nature of the model offers advantages for future analytical and empirical extensions. By formalizing the interactions among variables, the framework encourages computational simulation and quantitative sensitivity analysis. This aligns with the broader tradition in economics that views mathematical models as tools for testing theoretical consistency, generating predictions, and exploring counterfactual scenarios (Debreu, 1984). Vasconcelos (2013) demonstrated the value of symbolic and numerical computation in exploring growth trajectories, reinforcing the idea that conceptual economic models can serve as foundations for more detailed numerical analysis. In this sense, the Economics Equation–3 framework provides a conceptual seed that could be operationalized using empirical data, agent-based modeling, or system dynamics simulations.

Finally, the model carries implications for policy design and strategic planning. Governments and institutions can use the framework to identify leverage points where interventions yield the highest returns—such as improving logistics infrastructure, supporting workforce development, or mitigating risks associated with shocks and uncertainty. Because the model distinguishes between growth drivers and constraints, it allows policymakers to target both sides of the development equation. In addition, the emphasis on flow dynamics highlights the importance of aligning production with market reality rather than treating them as separate spheres.

In summary, the Economics Equation–3 framework enriches the conceptual landscape of development economics by bridging systems thinking, mathematical representation, and evolutionary theory. While conceptual and not empirical, it offers a structured basis for future modeling, calibration, and policy-oriented research.

The model supports the notion that economic development is a systemic process shaped by complex interactions, consistent with evolutionary and interdisciplinary frameworks (Dopfer, 2005; Petrakis, 2020). It emphasizes that strong economies emerge when positive forces expand faster than constraints, and when market flow remains adaptive to time, location, and demand. The symbolic approach encourages future numerical calibration and simulation, aligning with the mathematical modeling traditions highlighted by Vasconcelos (2013) and Debreu (1984).

5. Conclusion

The Economics Equation–3 framework presented in this study offers a conceptual and symbolic approach to understanding how economic strength emerges from the interaction among productive forces, market flow dynamics, and negative constraints. Rather than attributing development to a single factor, the model emphasizes the need for alignment between growth-supporting variables—such as product quality, workforce capacity, and policy support—and adaptive market mechanisms shaped by time, location, and customer characteristics. At the same time, the model acknowledges that high costs, logistical bottlenecks, volatility, and systemic shocks exert downward pressure on growth outcomes. The resulting economic performance depends on the degree to which positive drivers expand faster than limitations.

Although theoretical in nature, the model holds value for policy makers, businesses, and academic researchers. For policy makers, it provides a structured means of identifying leverage points for intervention, allowing governments to enhance productive capacity while minimizing structural barriers and external vulnerabilities. For firms and industries, the framework highlights the importance of integrating production strategies with market conditions rather than treating them as isolated domains. For academic researchers, the symbolic configuration creates opportunities for analytical refinement, mathematical formalization, and interdisciplinary dialogue between economics, systems science, and quantitative modeling.

Future research can advance the framework by operationalizing it in several directions. One promising avenue is empirical calibration using sectoral or national datasets to test the sensitivity of performance outcomes to different configurations of productive factors, market flows, and constraints. Another direction involves simulation-based approaches, such as system dynamics or agent-based modeling, which can explore nonlinear trajectories and adaptive behavior under varied policy scenarios. Comparative research across countries or industries may also yield insights into how structural heterogeneity shapes the model’s parameters and predictive reliability.

In summary, Economics Equation–3 provides a foundational conceptual system that invites further development, empirical testing, and policy-oriented application in the field of economic growth and development..

References

Mashrafi, M. (2026). Universal Life Energy–Growth Framework and Equation. International Journal of Research13(1), 79-91.

Mashrafi, M. (2026). Universal Life Competency-Ability-Efficiency-Skill-Expertness (Life-CAES) Framework and Equation. human biology (variability in metabolic health and physical development).

Fusfeld, D. R. (1980). The conceptual framework of modern economics. Journal of Economic Issues14(1), 1-52.

Vasconcelos, P. B. (2013). Economic growth models: symbolic and numerical computations. Advances in Computer Science: an International Journal2(5), 47-54.

Czerwinski, A. (2024). Mathematics serving economics: a historical review of mathematical methods in economics. Symmetry16(10), 1271.

Weaver, J. H. (1993). Exports and economic growth in a simultaneous equations model. The Journal of Developing Areas27(3), 289-306.

Debreu, G. (1984). Economic theory in the mathematical mode. The American Economic Review74(3), 267-278.

Dopfer, K. (2005). Evolutionary economics: a theoretical framework. The evolutionary foundations of economics, 3-55.

Petrakis, P. E. (2020). Theoretical approaches to economic growth and development. An Interdisciplinary Perspective. Switzerland: National and Kapodistrian University of Athens, 26-544.

Debreu, G. (1989). Theoretic models: mathematical form and economic content. In Joan Robinson and Modern Economic Theory (pp. 264-277). London: Palgrave Macmillan UK.

Ramkissoon, H. (2015). Authenticity, satisfaction, and place attachment: A conceptual framework for cultural tourism in African island economies. Development Southern Africa32(3), 292-302.

Ghadim, A. K. A., & Pannell, D. J. (1999). A conceptual framework of adoption of an agricultural innovation. Agricultural economics21(2), 145-154.

Domain-Dependent Validity of an Inequality Derived from a Classical Absolute Value Identity

Daily writing prompt
What do you complain about the most?

Mashrafi, M. (2026). Domain-Dependent Validity of an Inequality Derived from a Classical Absolute Value Identity. International Journal for Social Studies, 12(1), 32–42. https://doi.org/10.26643/ijss/2026/2


Mokhdum Mashrafi (Mehadi Laja)
Research Associate, Track2Training, India
Researcher from Bangladesh
Email: mehadilaja311@gmail.com

Abstract

The classical identity √(−Y)² = |Y| is universally valid for all real Y, arising from the principal square root and absolute value definitions. However, when this identity is reformulated as an inequality—namely √(−Y)² ≤ Y—its validity becomes domain-restricted rather than universal. This paper provides a rigorous analytical examination of the inequality and demonstrates that it holds if and only if Y ≥ 0. For Y < 0 the inequality fails due to the non-negativity constraint imposed by the principal square root. The results highlight that transforming universally valid equalities into inequalities introduces implicit logical constraints not visible in the original formulation. The findings underscore the importance of explicit domain awareness in algebraic reasoning, inequality analysis, and pedagogical practice.

Keywords: absolute value, inequality analysis, real numbers, square root, domain restriction, algebraic logic

1. Introduction

In elementary algebra and real analysis, one encounters a variety of foundational identities that appear deceptively simple yet encode nontrivial conceptual structures. Among these, the identity involving the principal square root of a squared real number, expressed in the canonical form √Y² = |Y|, occupies a central role in the theory of real-valued functions. This identity asserts that for any real number Y, applying the squaring operation followed by the principal square root yields the absolute value of Y rather than its original signed value. This result follows directly from two fundamental conventions: first, that the square of a real quantity is always non-negative; and second, that the principal square root function √· is defined to produce the unique non-negative real number whose square equals the input. Together, these conventions enforce that √Y² is never negative, even when Y itself is negative, thereby establishing equality with |Y| rather than Y.

The identity plays a crucial role in various branches of mathematics, including algebraic manipulation, analytic proofs, metric theory, inequality systems, vector calculus, and optimization frameworks. Students typically learn to apply this identity when simplifying radical expressions, solving equations involving absolute values, or analyzing distance functions in Euclidean space. Despite its ubiquity, the pedagogical presentation of this identity is often terse, leaving little room for discussing conceptual subtleties such as the principal value convention, the distinction between signed and unsigned magnitudes, or the domain-sensitive implications of logical transformations involving equalities and inequalities.

A particularly underexplored aspect arises when one considers not merely the identity itself, but transformations that involve replacing the equality sign with inequality symbols. In mathematical analysis, it is common to convert identities into inequalities when considering bounding relationships, constraint satisfaction, feasibility regions, or optimization criteria. Such transformations appear simple at first glance, yet they may introduce implicit logical restrictions on variable domains that are not evident in the original identity. For example, one might ask whether the expression √Y² ≤ Y holds for all real Y, or equivalently whether |Y| ≤ Y is universally valid. While the original equality √Y² = |Y| holds for every real number, the transformed inequality does not: it is satisfied only for non-negative values of Y. For negative values of Y, the expression fails, because |Y| becomes strictly greater than Y, reflecting the fact that the absolute value function removes sign rather than preserving it.

This observation illustrates a deeper conceptual phenomenon in mathematics: equalities can be logically symmetric and universally valid across entire domains, whereas inequalities typically encode asymmetric relations that depend critically on the sign, order, or domain of the variable. When transforming an equality into an inequality, one may unintentionally impose additional constraints that were absent in the original formulation. In the case of √Y² = |Y|, the identity is unconditional, and no assumptions about the sign of Y are required. However, the inequality √Y² ≤ Y implicitly demands that Y be non-negative, since √Y² represents a non-negative quantity while Y may take negative values. Thus, the inequality is neither universally valid nor equivalent to the original identity, but instead defines a proper subset of the real number system—namely the set of all Y such that Y ≥ 0.

The distinction between these two statements underscores the importance of domain awareness in algebraic reasoning. In textbooks and classroom instruction, students are rarely encouraged to interrogate domain restrictions unless explicitly solving inequalities or piecewise-defined functions. However, understanding when and why domain restrictions emerge is critical not only for higher mathematics, but also for applied fields such as optimization, control theory, computational modeling, and machine learning, where constraints and feasibility sets determine the correctness of solutions.

From a logical and pedagogical standpoint, the inequality-based interpretation of √(−Y)² is especially intriguing. One might initially assume that since squaring removes sign information and the square root function returns a non-negative output, the expression √(−Y)² is algebraically interchangeable with √Y². Indeed, in terms of algebraic value, both reduce to |Y| without exception. Yet, when comparing √(−Y)² directly to Y rather than |Y|, the sign of Y becomes decisive. For Y ≥ 0, both √Y² and Y yield the same non-negative value, and the inequality √(−Y)² ≤ Y is satisfied as an equality. For Y < 0, however, the expression √(−Y)² equals −Y, which is strictly positive, while Y itself is negative; hence the inequality fails. This introduces a stark boundary at zero, revealing that what was once an unconditional equality can become a conditional statement partitioning the real line into validity and invalidity regions.

This study focuses precisely on these logical and domain-sensitive implications. By examining the expression √(−Y)² and its relational comparison with Y through the inequality √(−Y)² ≤ Y, the work aims to clarify how subtle domain conditions emerge from inequality reformulation. Although √(−Y)² equals |Y| algebraically, the inequality introduces a nontrivial domain constraint dependent on the sign of Y. Through formal characterization, this analysis demonstrates that such transformations are not merely symbolic exercises, but encode structural truths about real-number operations, sign behavior, and the semantics of comparison operators.

The broader significance lies in reinforcing a more rigorous culture of algebraic thinking. Mathematics is full of statements that appear obvious in one form yet reveal deeper layers when expressed differently. By making these layers explicit, we gain more refined tools for both teaching and research, encouraging learners to transition from procedural manipulation to conceptual understanding. The exploration presented here is therefore not merely a technical exercise, but an illustration of how foundational algebraic concepts can continue to yield insights when viewed through new interpretive lenses.

2. Methods

Figure 1: Analytical framework

The analytical framework employed in this study draws upon foundational concepts from real analysis, algebraic logic, and inequality theory. The objective of the methodological approach is to determine the domain-specific conditions under which the inequality holds, despite the universal validity of the underlying identity . The approach proceeds through three interconnected methodological components, each of which contributes to a rigorous evaluation of domain-sensitive validity.

1. Absolute Value Theory


The starting point of the analysis relies on the theoretical definition of the absolute value function. For any real number , the absolute value is defined piecewise as:

This definition encapsulates the notion that absolute value represents magnitude without sign. In the context of the present study, the expression reduces directly to , which provides a bridge between radical expressions and piecewise-defined functions. By introducing this piecewise structure, the method explicitly anticipates that different domain intervals (such as and ) will exhibit different behaviors with respect to the target inequality.

2. Principal Square Root Properties

The second methodological component involves formal properties of the principal square root operator , which is defined to yield the non-negative real number whose square equals the argument. This definition is essential because it ensures for all . In the current context, since squaring eliminates sign, the expression is always non-negative, and thus its principal square root satisfies for every real . This property plays a determinant role when comparing with , because if , the left-hand side becomes non-negative while the right-hand side becomes strictly negative, creating an inherent asymmetry.

3. Inequality Reformulation and Case-Based Evaluation

The final component reformulates the inequality analytically. Using the equality , the target inequality becomes . Since is piecewise-defined, the inequality must be evaluated separately for the intervals and . This case-based evaluation allows the study to determine precisely where the inequality holds and where it fails, yielding a domain-sensitive conclusion.

Together, these three methodological steps provide a structured and rigorous framework for analyzing domain-dependent validity in algebraic inequalities.

3. Results

3.1 Reformulation

From:

the inequality becomes:

The first step in the analytical process involves rewriting the given radical expression in a form that reveals its algebraic structure more transparently. Starting from the expression , we note that it follows the same transformation principle as the more common form . In both cases, the squaring operation eliminates the sign information of the inner quantity, producing a non-negative result, and the principal square root operator returns the non-negative magnitude. This allows us to invoke the well-established identity for any real number . Accordingly, if we treat as the inner argument, its squared value will be non-negative, and therefore . When the specific expression simplifies to , the identity becomes , reflecting the magnitude of independently of its sign. This reformulation bridges radical expressions with absolute value theory and sets the stage for inequality-based reasoning.

Once the radical expression has been converted into absolute value notation, the inequality under study becomes significantly more tractable. The original inequality involving the square root can now be expressed in terms of absolute values as . This transformation is crucial for two reasons. First, it replaces a radical expression with a piecewise-defined function, which naturally leads to domain-based interpretation. Second, it makes explicit that the analytical challenge is no longer about evaluating a square root, but rather about understanding how the sign of influences the relationship between and . Since the absolute value function either preserves or negates its input depending on its sign, the reformulated inequality highlights that the validity of the original inequality hinges entirely on the sign of . The reformulation therefore serves as a critical methodological link between symbolic manipulation and domain-sensitive inequality analysis.

3.2 Domain Evaluation

Two cases are analyzed:

  • Case 1: Y ≥ 0
    Here |Y| = Y, so the inequality holds as equality.
  • Case 2: Y < 0
    Here |Y| = −Y > Y, so the inequality fails.

After reformulating the expression into the inequality , the next step is to determine the domain over which this inequality holds true. Since the absolute value function is defined in a piecewise manner, its behavior depends on the sign of . Therefore, the evaluation naturally requires a division of the real number line into distinct intervals corresponding to non-negative and negative values of . This case-based approach is essential because the inequality may demonstrate different logical outcomes in each interval, even though the original identity is universally valid over all real numbers.

In the first case, when , the definition of the absolute value function reduces to . Substituting this into the inequality yields , which holds as an equality. Consequently, for all non-negative values of , the original inequality is satisfied. In the second case, when , the definition of absolute value becomes . Since whenever is negative, the substituted inequality becomes , which is false. Thus, no negative value of satisfies the inequality. The case-based evaluation therefore reveals a sharp contrast between positive and negative domains, demonstrating that sign plays a decisive role in the inequality’s validity.

3.3 Final Result

The inequality holds if and only if:

Based on the above domain evaluation, it becomes clear that the inequality — and by extension — is not universally valid over the real numbers. Instead, its validity is restricted to those values of for which the absolute value function does not introduce a sign change. Formally, the inequality holds if and only if . For all values of , the inequality fails because the non-negative output of the principal square root cannot be less than or equal to a negative input.

This result highlights a crucial conceptual conclusion: while algebraic equalities involving radicals and squares can be universally valid, inequalities derived from them may exhibit domain-dependent truth conditions. The sign of the variable becomes the determining factor, turning a seemingly simple expression into a conditional statement about subsets of the real line.


4. Discussion

The results show that converting a universally valid equality into an inequality introduces domain constraints not present in the original expression. The principal square root ensures a non-negative outcome, which creates sign-sensitive relational effects when compared with an unrestricted real variable.

The findings of this study demonstrate that transforming a universally valid algebraic equality into an inequality can fundamentally alter the logical conditions under which the resulting statement remains true. The identity is valid for all real values of because it rests on definitions that apply unconditionally over the real number system: squaring removes sign information, and the principal square root returns the non-negative magnitude of its argument. However, once the equality is reformulated into the inequality , the universal validity disappears. The inequality no longer holds for all ; instead, its validity becomes contingent on the sign of , yielding a domain restriction to . This shift from an unrestricted to a restricted domain illustrates how relational operators such as ≤ or ≥ introduce asymmetry into statements that were originally symmetric under equality.

A key reason for this shift lies in the non-negativity constraint embedded within the principal square root function. The operator is defined to return the unique non-negative real number whose square equals the input. As a result, is always non-negative, while itself may be negative. When the inequality compares a non-negative quantity to a potentially negative one, a sign conflict arises: if , then , making the inequality false. This asymmetry is invisible in the original equality because equality imposes a bidirectional condition of equivalence that is satisfied regardless of sign. In contrast, inequality imposes a directional relation that only holds over a restricted subset of values. The result reinforces the broader principle that inequality reasoning requires more careful attention to sign behavior and functional range than equality reasoning does.

More broadly, this analysis reveals an important conceptual insight: a universally true algebraic identity can become a conditionally true inequality depending on the relational operator and the assumed domain of discourse. This observation is frequently overlooked in routine algebraic instruction, where students learn to manipulate symbols in a procedural manner without explicitly considering domain constraints. For instance, many algebraic techniques—such as applying square roots, dividing by variables, or expanding absolute values—are valid only under certain domain assumptions. When these assumptions remain implicit, errors may arise in both computation and reasoning. The present study highlights the need to make such assumptions explicit, particularly in foundational learning environments.

This insight has practical implications beyond pure algebra. In real analysis, inequalities often act as tools for bounding functions, defining convergence criteria, or establishing continuity and differentiability properties. In optimization and constraint modeling, inequalities define feasible solution spaces, control stability conditions, and determine whether a candidate solution satisfies required constraints. In such contexts, misunderstanding domain restrictions can lead to incorrect feasible sets, invalid assumptions about optimality, or flawed proofs regarding solution existence. Awareness of domain conditions therefore contributes directly to mathematical rigor and theoretical correctness.

The pedagogical implications are equally significant. Modern mathematics education has increasingly emphasized conceptual understanding over mechanical symbol manipulation. Encouraging students to reflect on domain assumptions and the behavior of functions under relational transformation aligns with this goal. By presenting examples such as the inequality derived from , instructors can illustrate how expressions that seem trivial in equality form can become nontrivial when reinterpreted under inequalities. Such instruction fosters more robust logical reasoning and prepares students for advanced topics where domain issues are central, including measure theory, functional analysis, and numerical methods.

Finally, the discussion situates this work within the broader context of algebraic logic. Algebraic expressions are not merely computational artifacts but encode structural relationships governed by definitions, operators, and domains. Recognizing how these components interact is essential to understanding when and why mathematical statements hold. The present study contributes to this understanding by clarifying how the interplay between the principal square root, absolute value, and inequality operators generates domain-sensitive outcomes. Taken together, these observations reinforce that seemingly simple manipulations can have deep logical consequences, and that mathematical rigor requires attention not just to formulas, but to the structural assumptions they implicitly carry.

More broadly, this reveals that:

A universally true equality can yield a conditionally true inequality depending on the relational operator and domain assumptions.

This insight is relevant in real analysis, constraint modeling, and mathematical pedagogy, where rigor and domain awareness are crucial. Highlighting such constraints supports conceptual understanding and discourages overly procedural manipulation without logical interpretation.

5. Conclusion

The inequality derived from the classical identity holds only for non-negative values of Y. While the equality form is valid for all real numbers, the inequality form becomes domain-restricted. This demonstrates the importance of recognizing implicit logical constraints when performing algebraic transformations involving inequalities.

This study examined the inequality obtained from a classical algebraic identity and demonstrated that its validity is restricted to a subset of the real number system. While the underlying equality holds universally for all real values of , the derived inequality is satisfied only when . For , the inequality fails due to the non-negativity of the principal square root, which produces values that cannot be less than or equal to negative quantities. This contrast highlights a key conceptual point: equality-based identities may retain validity over entire domains, whereas their inequality counterparts may introduce implicit restrictions that alter the set of permissible input values.

The results emphasize the importance of recognizing and articulating domain assumptions when performing algebraic transformations, particularly those involving inequalities and absolute values. Failure to acknowledge such constraints can lead to incorrect conclusions, especially in contexts involving optimization, analysis, and proof-based reasoning. By making these logical boundaries explicit, this work contributes to a deeper understanding of how structural properties of functions shape mathematical statements, and it underscores the pedagogical value of treating equalities and inequalities not as interchangeable symbolic forms, but as distinct logical objects with different domain implications.

References

Mashrafi, M. (2026). Universal Life Energy–Growth Framework and Equation. International Journal of Research, 13(1), 79–91.

Mashrafi, M. (2026). Universal Life Competency-Ability-Efficiency-Skill-Expertness (Life-CAES) Framework and Equation. Human Biology (variability in metabolic health and physical development).

Lamberti, P. D., & de Cristoforis, M. L. (2005). A global Lipschitz continuity result for a domain-dependent Neumann eigenvalue problem for the Laplace operator. Journal of Differential Equations, 216(1), 109–133.

Finnie, G., & Sun, Z. (2002). Similarity and metrics in case‐based reasoning. International Journal of Intelligent Systems, 17(3), 273–287.

Harari, I., & Hughes, T. J. (1992). What are C and h?: Inequalities for the analysis and design of finite element methods. Computer Methods in Applied Mechanics and Engineering, 97(2), 157–192.

Segu, M., Tonioni, A., & Tombari, F. (2023). Batch normalization embeddings for deep domain generalization. Pattern Recognition, 135, 109115.

Huo, T., et al. (2025). A novel domain generalization network integrating invariance and cohesiveness for rolling bearing fault diagnosis. Structural Health Monitoring.

Vänskä, S., & Taskinen, M. (2008). Domain dependent Dirac’s delta and derivatives with an application to electromagnetic boundary integral representations. Journal of Mathematical Analysis and Applications, 344(1), 546–556.

Schatz, A. H. (1980). A weak discrete maximum principle and stability of the finite element method in . Mathematics of Computation, 34(149), 77–91.

Dun, A., Geng, Z., & Huang, L. (2011). Design of controller for Lur’e systems guaranteeing dichotomy. Applied Mathematics and Computation, 217(22), 8927–8935.

Long, M., Wang, J., Sun, J., & Yu, P. S. (2014). Domain invariant transfer kernel learning. IEEE Transactions on Knowledge and Data Engineering, 27(6), 1519–1532.

Tseng, V. S., Chen, L. C., & Kao, C. P. (2008). Constrained clustering for gene expression data mining. In PAKDD (pp. 759–766). Springer.

Plants as Responsive Biological Systems: Integrating Physiology, Signalling, and Ecology- The Hidden Emotions of Plants: The Science of Pleasure, Pain, and Conscious Growth

Daily writing prompt
What are your favorite sports to watch and play?

Citation

Mashrafi, M. (2026). Plants as Responsive Biological Systems: Integrating Physiology, Signalling, and Ecology- The Hidden Emotions of Plants: The Science of Pleasure, Pain, and Conscious Growth. International Journal of Research, 13(1), 543–559. https://doi.org/10.26643/ijr/2026/26


Mokhdum Mashrafi (Mehadi Laja)

Research Associate, Track2Training, India

Researcher from Bangladesh

Email: mehadilaja311@gmail.com

Abstract

Plants have historically been viewed as passive biological entities lacking sensation, emotion, or intelligence. Advances in plant physiology, electrophysiology, ecology, and bio-interfacing, however, reveal a vastly more complex picture. Plants perceive a wide spectrum of environmental cues, generate electrical and chemical signaling networks, and exhibit adaptive behaviors analogous to learning, memory, decision-making, and stress responses. While these processes do not constitute emotions in the human or animal sense, they represent a functional system of growth-mediated responsiveness that advances survival and environmental attunement. This paper synthesizes emerging research across plant signaling, sensory ecophysiology, distributed intelligence, and human–plant interaction design to explore how plants experience and respond to the world. By integrating biological mechanisms with philosophical perspectives on consciousness and affect, it proposes a framework for understanding plants as responsive biological systems embedded within ecological and relational contexts. The goal is not to anthropomorphize plant life but to expand scientific language beyond outdated binaries and acknowledge plants as dynamic participants in biospheric intelligence.

Keywords

Plant signaling; plant intelligence; electrophysiology; sensory ecology; adaptive behavior; plant awareness; bio-interfacing; emotional analogs; consciousness studies; ecological physiology.

Introduction

Plants have long been regarded as passive, insentient organisms governed purely by biochemical growth processes and environmental constraints. This perception was reinforced by anthropocentric criteria for sensation and emotion, which equated subjective experience with the presence of a nervous system or centralized brain structures (Hamilton & McBrayer, 2020). Yet research over the past decades in plant physiology, electrophysiology, behavioral ecology, and philosophy of biology increasingly challenges this framework, suggesting that plants possess sophisticated systems of perception, response, and adaptive regulation (Trewavas, 2014; Gagliano et al., 2017).

Contemporary plant science describes plants as organisms that continuously sense and integrate environmental variables such as light spectrum, gravity, mechanical stress, volatile chemicals, temperature, soil moisture, nutrient availability, and biotic threats. These stimuli are processed through interconnected networks of hormones, ion channels, electrical signaling, biomechanical feedback, and gene regulation (Panda et al., 2025). Many of these mechanisms produce context-dependent and graded responses—properties associated with adaptive decision-making rather than simple reflex arcs.

Electrical signaling in plants provides one of the most compelling lines of evidence. Variation potentials and action potentials propagate systemic information following herbivore attack, injury, or environmental shifts, enabling coordinated physiological responses (Debono & Souza, 2019). While not homologous to animal neural pathways, these signals demonstrate that plants maintain internal communication architectures capable of rapid modulation and systemic integration. Combined with volatile organic compound (VOC) exchange, plants also communicate with neighboring individuals, warn others of danger, and recruit mutualistic organisms—behaviors once thought exclusive to animals (Myers, 2015).

From a sensory perspective, plants demonstrate remarkable perceptive sophistication. Photoreceptors detect light intensity, wavelength, duration, direction, and periodicity, shaping circadian regulation, flowering, morphogenesis, and pigmentation strategies. Floral coloration, fragrance, and nectar production represent energetically costly signaling systems that mediate ecological relationships, particularly through co-evolution with pollinators (Calvo, 2017). These systems imply a form of environmental modeling that expresses itself through growth, chemical output, and allocation of metabolic resources.

The question of whether plants feel or experience pain has generated philosophical debate. While plants lack neurons and nociception pathways, some scholars argue that sensory processing and defensive responses reflect a non-neural form of affective adaptation (Hamilton & McBrayer, 2020). Neuroscientific perspectives caution, however, that pain as an emotion must remain linked to conscious perception and affective circuitry (LeDoux, 2012), prompting the need to distinguish between functional analogs and subjective experience.

Human–plant interaction research is beginning to incorporate these findings into applied contexts. Novel interfaces and bi-directional feedback systems seek to cultivate empathy and pro-environmental behavior by visualizing plant responses and communication signals (Luo et al., 2025). Philosophical and artistic explorations further highlight the conceptual challenges involved in understanding plant perspectives and sensory modalities (Gagliano et al., 2017).

To contextualize plant responsiveness within broader biological theory, recent contributions in systems biology emphasize competencies, efficiency, and energetic dynamics as universal organizing principles across life forms (Mashrafi, 2026a; Mashrafi, 2026b). This approach supports the idea that plant awareness and adaptive intelligence emerge not from neural processing, but from distributed physiological control embedded in metabolic and ecological networks.

Recognizing plants as responsive, communicative, and adaptive organisms does not require attributing human-like consciousness or emotional pain. Instead, it invites a shift toward viewing plants as participants in a continuum of biological intelligence, distinguished by their growth-based, decentralized mode of interaction with the world. This paper therefore examines the sensory, signaling, and adaptive dimensions of plant life; articulates distinctions between empirical evidence and metaphor; and explores how integrating physiology, signaling, and ecology reveals a hidden emotional–responsive dimension of plant existence.

1. The Functional–Emotional Structure of Plants

Bioelectric Signaling, Sensory Integration, and Reproductive Responsiveness

Plants do not possess centralized nervous systems or brains; however, this absence does not imply the absence of internal signaling, coordination, or adaptive responsiveness. Modern plant physiology demonstrates that plants operate through distributed bioelectrical, biochemical, and hormonal networks that enable long-distance communication between roots, stems, leaves, and reproductive organs. These networks allow plants to detect environmental cues, integrate information, and generate context-dependent responses essential for survival and reproduction.

At the electrophysiological level, plants generate action potentials and variation potentials—measurable electrical signals propagated through vascular tissues such as the phloem. Although these signals travel more slowly than animal neural impulses, they serve analogous systemic functions: transmitting information about mechanical stress, injury, hydration status, and reproductive readiness. These bioelectric signals regulate gene expression, hormone distribution, and metabolic allocation, functioning as a decentralized information-processing system rather than reflexive chemistry alone.

Reproductive biology provides a particularly compelling demonstration of plant sensory and response capacity. In dioecious and functionally separated reproductive systems—such as those observed in Carica papaya—successful fruit formation depends on precise synchronization between male pollen release and female floral receptivity. This synchronization is mediated by chemical signaling (volatile organic compounds), photoperiod sensitivity, temperature thresholds, and pollinator-mediated feedback loops. Floral structures emit species-specific chemical and spectral cues that attract pollinators, while receptive tissues undergo transient physiological changes that enable fertilization only within optimal time windows.

These processes do not require conscious intention, yet they reflect selective responsiveness rather than mechanical inevitability. The plant’s reproductive system actively discriminates between compatible and incompatible signals, adjusts investment based on environmental conditions, and reallocates energy toward growth, defense, or reproduction depending on internal and external feedback. In functional terms, this resembles biological “preference” or “valuation,” though expressed through growth modulation and biochemical thresholds rather than subjective experience.

From a systems perspective, pollination can be understood as an information-matching process rather than a passive event. The presence of male and female structures alone is insufficient; successful fertilization requires signal recognition, temporal alignment, and physiological readiness. These conditions imply that plants possess sensory thresholds, activation states, and adaptive response mechanisms—features characteristic of responsive living systems across biological kingdoms.

Importantly, describing these processes as forms of “plant emotion” does not imply that plants experience pain, pleasure, or desire in the human or animal sense. Instead, it reflects a broader scientific reinterpretation of emotion as organized biological responsiveness to internal needs and external stimuli. In this framework, emotion is not defined by consciousness alone but by function: the capacity to detect significance, prioritize responses, and regulate behavior toward continuation of life.

Thus, plant reproduction—particularly pollination-dependent fruiting—demonstrates that plants are not inert entities but active participants in ecological communication networks, operating through electrical signaling, chemical attraction, and adaptive growth regulation. Their “emotional structure,” when defined scientifically, resides not in feeling as humans feel, but in the integrated signaling architectures that guide survival, reproduction, and evolutionary success.

2. Pleasure, Pain, and Communication Plant Perception, Stress Signaling, and Adaptive Response Systems

Bio-mimicking slow kinks. (a) The leaflets of a Mimosa Pudica ...Experiment: Sensitive Mimosa Pudica Electrophysiology | BYB ...

Plants lack neurons and centralized brains, yet they exhibit rapid, coordinated responses to environmental stimuli that require perception, signal transduction, and systemic integration. One of the most extensively studied examples is Mimosa pudica, commonly known as the “touch-me-not” plant. When mechanically stimulated, its leaflets fold within seconds—a response driven by mechano-electrical signal transduction rather than simple reflexive motion. Mechanical pressure triggers ion fluxes, particularly potassium and calcium, leading to rapid changes in turgor pressure within specialized motor cells (pulvini). This response is repeatable, reversible, and stimulus-dependent, demonstrating that plants can detect external signals and convert them into organized physiological action.

Electrophysiological studies confirm that Mimosa pudica generates action potentials that propagate through vascular tissues following touch, heat, or injury. These electrical signals share fundamental properties with animal action potentials—threshold activation, all-or-none behavior, and signal propagation—though they occur at slower speeds and serve decentralized regulatory roles. Such signaling enables the plant to distinguish between harmless and potentially damaging stimuli, indicating perception rather than random reaction.

Beyond mechanical sensing, plants respond to tissue damage through a suite of systemic wound signals involving electrical impulses, calcium waves, hydraulic pressure changes, and phytohormone cascades (notably jasmonates and ethylene). When a leaf is cut, burned, or attacked by herbivores, these signals spread rapidly throughout the plant, activating defense genes, altering metabolism, and reallocating resources. While this process is not “pain” in the neurological sense, it is functionally analogous to nociception—the detection and response to harmful stimuli—widely recognized in animals and increasingly discussed in plants as a defensive sensory capacity.

Plant communication extends beyond internal signaling to inter-plant and ecosystem-level information exchange. Plants release volatile organic compounds (VOCs) in response to stress, which neighboring plants can detect and respond to by preemptively activating defense mechanisms. These chemical messages function as early-warning systems and contribute to collective resilience within plant communities. Additionally, plants exhibit synchronized electrical and biochemical signaling when growing in proximity, mediated through soil networks, root exudates, and mycorrhizal associations. Although these interactions are sometimes described metaphorically as “emotional” or “vibrational,” scientifically they represent low-frequency biological signaling and chemical information transfer, not conscious communication.

Environmental favorability also elicits measurable internal changes in plants. Optimal light spectra, adequate water availability, and sufficient mineral nutrition lead to increased photosynthetic efficiency, hormonal balance, cell division, and biomass accumulation. Under deprivation—such as prolonged darkness, drought, or nutrient deficiency—plants exhibit stress physiology: reduced growth rates, altered gene expression, oxidative stress, and eventual senescence. These transitions reflect state-dependent physiological regulation, not subjective pleasure or suffering, but they parallel the functional role emotions play in animals: signaling internal conditions and guiding adaptive responses.

Crucially, modern plant science distinguishes between sentience and sensitivity. Plants do not possess consciousness or emotional experience as humans or animals do; however, they are highly sensitive biological systems capable of perceiving stimuli, prioritizing responses, and modifying future behavior based on past exposure. Memory-like effects—such as habituation in Mimosa pudica, where repeated non-harmful stimuli result in diminished response—demonstrate that plant signaling is context-aware and adaptive rather than purely mechanical.

In this scientific framework, “pleasure” and “pain” serve as metaphors for growth-promoting versus stress-inducing physiological states. Plants shift dynamically between these states through integrated electrical, chemical, and metabolic signaling networks. The transition from vigorous growth to decline—from bloom to senescence—is governed by internal feedback mechanisms that continuously evaluate environmental conditions and energetic viability.

Thus, plant behavior reveals not emotion in the human sense, but a distributed biological intelligence—one that enables perception, communication, and adaptive regulation without a nervous system. Recognizing this complexity expands our understanding of life as a continuum of responsive systems, rather than a hierarchy divided sharply between “feeling” and “non-feeling” organisms.

3. Color and Feeling in Nature

Optical Signaling, Physiological State, and Ecological Communication in Plants

Color in nature is not merely decorative or aesthetic; it is a biologically functional signal that conveys information about physiological state, metabolic activity, and ecological intent. In plants, coloration arises from the controlled synthesis, degradation, and spatial distribution of pigments such as chlorophylls, carotenoids, and anthocyanins. These pigments do not appear randomly. Their presence, absence, or transformation reflects tightly regulated biochemical processes responding to environmental conditions and internal energy balance.

In flowers, bright colors—such as yellow, red, blue, or ultraviolet-reflective patterns—serve as reproductive communication signals. These colors are tuned to the visual systems of pollinators and often coincide with nectar production, fragrance emission, and optimal pollen viability. For example, yellow floral pigmentation commonly results from carotenoids, which are energetically costly to synthesize and therefore reliably signal reproductive fitness. In this context, color functions as an attraction signal, enhancing pollination success and genetic continuation.

By contrast, when similar yellow coloration appears in leaves, it frequently indicates chlorophyll degradation, reduced photosynthetic capacity, or nutrient deficiency—most notably nitrogen, magnesium, or iron shortage. This process, known as chlorosis, reflects a shift from growth-oriented metabolism toward stress response or senescence. The same pigment family that signals vitality in flowers thus signals physiological decline in foliage, depending on location, timing, and tissue function. This context-dependence demonstrates that plant color operates as a state-dependent information system, not a static visual trait.

During seasonal transitions, such as autumnal senescence, green chlorophyll breaks down, revealing underlying carotenoids and anthocyanins. This color transformation is associated with nutrient reabsorption, oxidative stress management, and controlled tissue aging. Far from being passive decay, senescence is an actively regulated developmental phase, orchestrated through gene expression and hormonal signaling. Color change here marks a transition in the plant’s internal state—from active carbon acquisition to resource conservation and survival.

From an ecological perspective, color also plays a defensive and communicative role. Certain pigment changes deter herbivores, signal toxicity, or reduce photodamage under excessive light. Anthocyanin accumulation, for example, can protect tissues from oxidative stress and ultraviolet radiation while simultaneously altering visual appearance. Neighboring organisms—pollinators, herbivores, or even other plants—respond differently to these visual cues, integrating color into broader ecological feedback loops.

Although it is tempting to describe these color changes as expressions of “mood” or “emotion,” a scientifically precise interpretation frames them as optical manifestations of physiological condition. In animals, emotions serve to integrate internal states with external behavior; in plants, pigment-driven color shifts fulfill an analogous functional role by signaling internal status and guiding ecological interaction—without implying consciousness or subjective feeling.

Thus, color in plants can be understood as a biochemical language—one that reveals health, stress, reproductive readiness, and developmental phase. The same wavelength may signify attraction or distress depending on tissue type and physiological context. This duality underscores that plant coloration is not symbolic but informational, translating metabolic processes into visible signals that regulate interaction with the environment.

In this scientifically grounded sense, color functions as a bridge between internal plant physiology and external ecological communication. It reflects how plants “experience” favorable or unfavorable conditions—not through emotion as humans define it, but through precisely regulated biological responses that make their internal state visibly legible to the living world around them.

4. Light, Energy, and the Integrative Environmental “Master Force”

Photobiology, Temporal Rhythms, and Systems-Level Regulation of Plant Life

In classical physics, the speed of light in vacuum is constant, a principle confirmed by extensive experimental evidence and fundamental to modern physics. However, biological systems do not respond to light solely as a fixed-speed physical constant. Instead, living organisms—particularly plants—respond to light as structured energy, characterized by wavelength, intensity, duration, periodicity, and directional coherence. It is these dynamic properties of light, rather than its velocity, that drive seasonal variation and biological differentiation.

Plants do not measure light in meters per second; they measure it in time, frequency, and spectral composition. This distinction explains why long-day and short-day plants respond differently under what appears to be the same sunlight intensity. The key factor is photoperiodism—the biological response to the relative length of day and night—mediated by internal molecular clocks synchronized with environmental light–dark cycles. Even when total sunlight energy is similar, changes in day length alter gene expression, hormone production, and developmental pathways.

At the molecular level, plants possess specialized photoreceptors (such as phytochromes and cryptochromes) that detect specific light wavelengths and convert them into biochemical signals. These signals regulate flowering time, stem elongation, leaf expansion, and dormancy. Importantly, plants measure night length, not day length—a clear indication that biological timekeeping, rather than raw light intensity, governs developmental decisions. This reveals light as a temporal signal as much as an energy source.

From a physical perspective, light exhibits wave–particle duality, meaning it carries energy in discrete quanta while propagating as oscillating electromagnetic waves. Plants are exquisitely tuned to these oscillatory properties. The rhythmic absorption of photons entrains circadian clocks, aligns metabolic cycles, and synchronizes growth with seasonal and planetary rhythms. In this sense, life responds not to static illumination but to structured oscillations embedded in the environment.

The concept I describe as a “Master Force” can be scientifically reframed as the integrated field of environmental rhythms—a convergence of solar radiation cycles, Earth’s rotation, orbital dynamics, atmospheric circulation, and electromagnetic energy flow. Together, these factors create predictable patterns in light availability, temperature, humidity, and wind. Plants evolve within this rhythmic framework and depend on it for survival. Growth, flowering, senescence, and stress responses all emerge from continuous interaction with these coupled environmental oscillations.

Wind patterns influence transpiration and gas exchange; light cycles regulate photosynthesis and hormonal timing; temperature gradients affect enzyme kinetics and membrane stability. None of these forces act in isolation. Instead, they form a coherent environmental system that governs biological behavior across scales—from gene expression to ecosystem structure. What appears philosophically as a single guiding force is, scientifically, a systems-level integration of energy flows and temporal signals.

Crucially, plant responses to environmental change are not random. They follow phase-locked rhythms, meaning internal biological cycles synchronize with external periodic forces. This synchronization allows plants to anticipate change—flowering before optimal pollinator availability, entering dormancy before winter stress, or adjusting growth direction in response to shifting light fields. Such anticipatory behavior reflects not consciousness, but predictive biological regulation driven by rhythmic environmental input.

Thus, while physics confirms the constancy of light’s speed, biology reveals that life is shaped by how light arrives in time, not merely how fast it travels. The environment functions as a structured energetic field—one that integrates light, motion, and matter into rhythms that guide plant growth, resilience, and survival. In this scientifically grounded interpretation, the “Master Force” is not a mystical wave, but the ordered dynamics of energy and time that link cosmic processes to living systems on Earth.

5. The Philosophy of Plant Consciousness

Simplified schematic repre- sentation of plant defense ...https://wildlife.org.au/wp-content/uploads/2024/03/Tree-communication-diagram-600-x-400-px.jpgPreservation Matters: Landscape Maintenance - Protecting ...


Biological Awareness, Distributed Intelligence, and Ethical Responsibility

Plants are unequivocally alive in every biological sense: they respire, metabolize energy, grow, reproduce, communicate, and respond dynamically to internal and external conditions. Modern biology no longer views plants as passive matter, but as active, self-regulating systems capable of sensing their environment and modifying behavior accordingly. What remains debated is not whether plants respond, but how concepts such as awareness, intelligence, and consciousness should be defined beyond animal-centric frameworks.

Plants lack brains and subjective experience as humans understand it. However, they possess distributed sensory architectures that allow continuous environmental monitoring and coordinated response. Roots detect chemical gradients, moisture, gravity, and neighboring organisms; leaves sense light spectra, temperature, and atmospheric composition; vascular tissues transmit electrical and chemical signals across the entire organism. These integrated processes enable plants to maintain internal stability, anticipate environmental change, and optimize survival—hallmarks of biological awareness, even in the absence of consciousness as traditionally defined.

From a functional perspective, many plant structures serve roles analogous to those performed by specialized systems in animals. Bark functions as a protective barrier against mechanical damage, pathogens, and thermal stress. Roots form extensive sensing and signaling interfaces with soil ecosystems, integrating information across large spatial scales. Volatile compounds released by flowers and leaves communicate reproductive readiness, stress, or defense status to pollinators, symbionts, and neighboring plants. These processes are not symbolic emotions, but biological expressions of internal state, translated into chemical, electrical, and structural signals.

The idea that plant “emotions” exist in frequencies beyond human perception can be scientifically reframed as recognition that many biologically meaningful signals are invisible, inaudible, and intangible to human senses. Electrical potentials, calcium waves, hormonal gradients, and chemical volatiles all carry information essential to plant life, despite operating outside ordinary sensory awareness. Their reality is confirmed not by intuition, but by reproducible measurement and experimental validation.

Philosophically, this challenges the long-standing assumption that consciousness—or moral relevance—must be binary: present in animals, absent in plants. Instead, contemporary systems biology suggests a continuum of responsiveness, where living organisms differ not in whether they interact meaningfully with the world, but in how that interaction is structured. Plants express agency through growth, allocation, and signaling rather than movement or deliberation. Their “decisions” are encoded in biochemical pathways and developmental trajectories rather than neural thought.

Recognizing this does not require attributing suffering, pleasure, or self-awareness to plants. Rather, it calls for a recalibration of ethical language. Harm to plants is biologically consequential, disrupting organized systems of life that support ecosystems, climate regulation, and food webs. Ethical consideration, therefore, need not rest on plant consciousness in the human sense, but on respect for living systems and their intrinsic organizational value.

Care for plants—through sustainable cultivation, conservation, and restraint—aligns scientific understanding with moral responsibility. It acknowledges that plants are not inert resources, but participants in a shared biosphere governed by interconnected energy flows and feedback systems. To damage plant life without necessity is to disrupt these systems; to protect and nurture it is to sustain the conditions that make all complex life possible.

In this scientifically grounded philosophy, plant consciousness is not mysticism, nor is it human emotion projected onto greenery. It is a recognition that life expresses awareness in many forms—some cognitive, some chemical, some structural—and that humans, as conscious agents, bear responsibility toward the broader continuum of living organization that sustains us.

6. Conclusion

        https://www.researchgate.net/publication/331043392/figure/fig1/AS%3A11431281246086694%401716286870866/Flower-phenotypes-of-six-rose-cultivars-during-flower-development-Seven-developing.tif                                                                                            

Plants as Active Biological Systems in a Living Energy Continuum

Plants are not passive components of the natural world; they are active, responsive, and self-regulating biological systems embedded within continuous flows of energy, matter, and information. Through photosynthesis, plants transform solar radiation into chemical energy, forming the foundational energetic link that sustains nearly all life on Earth. This role alone establishes plants not as silent bystanders, but as primary architects of the biosphere.

Growth, flowering, fruiting, senescence, and decay are not emotional states in the human sense, yet they are measurable physiological phases governed by precise genetic, biochemical, and environmental regulation. Blooming represents a state of metabolic surplus, hormonal balance, and reproductive readiness, while decay reflects controlled nutrient reallocation, stress signaling, and the natural completion of a life cycle. These transitions are not random; they are structured responses to light cycles, temperature, water availability, and internal energy status.

Every leaf functions as a dynamic interface for gas exchange, light absorption, and thermal regulation. Every flower represents an optimized evolutionary solution for reproduction through signaling, attraction, and timing. Every seed embodies stored energy, genetic information, and environmental anticipation—capable of remaining dormant until external conditions signal viability. Collectively, these structures communicate the internal state of the plant to its surroundings, translating invisible physiological processes into visible form.

At the ecosystem level, plants continuously exchange information with their environment through chemical signals, electrical responses, and resource modulation. They respond to stress, cooperate with symbiotic organisms, warn neighboring plants of threats, and adjust growth strategies in anticipation of environmental change. These behaviors reflect biological awareness without consciousness—a mode of life in which responsiveness is expressed through structure, chemistry, and growth rather than sensation or intention.

Modern science increasingly recognizes that life exists along a continuum of organizational complexity, unified not by shared consciousness but by shared dependence on energy flow, feedback regulation, and adaptive response. In this continuum, plants occupy a distinct and indispensable domain: rooted yet dynamic, silent yet communicative, stationary yet deeply interactive. Their existence demonstrates that responsiveness to the environment does not require movement, perception as humans define it, or subjective experience to be real and meaningful.

Understanding plants in this way reshapes humanity’s relationship with the living world. It replaces the outdated view of plants as inert resources with a recognition of them as living systems whose integrity underpins ecological stability, climate regulation, and food security. Ethical responsibility toward plants does not arise from attributing human emotions to them, but from acknowledging their central role in sustaining life and maintaining planetary balance.

Ultimately, wherever energy flows in structured, self-organizing ways, life emerges. Plants are the most enduring expression of this principle—transforming light into matter, time into form, and environment into living structure. In recognizing their active role, science and philosophy converge on a simple truth: life is not defined by voice or motion, but by the continuous, responsive organization of energy across time.

References

Calvo, P. (2017). What is it like to be a plant?. Journal of Consciousness Studies24(9-10), 205-227.

Debono, M. W., & Souza, G. M. (2019). Plants as electromic plastic interfaces: A mesological approach. Progress in Biophysics and Molecular Biology146, 123-133.

Gagliano, M., Ryan, J. C., & Vieira, P. (Eds.). (2017). The language of plants: Science, philosophy, literature. U of Minnesota Press.

Hamilton, A., & McBrayer, J. (2020). Do plants feel pain?. Disputatio: International Journal of Philosophy12(56).

LeDoux, J. (2012). Rethinking the emotional brain. Neuron73(4), 653-676.

Luo, H., Kari, T., Patibanda, R., Montoya, M. F., Andres, J., Elvitigala, D. S., & Mueller, F. F. (2025, April). PlantMate: A Bidirectional Touch-Based System for Enhancing Human-Plant Empathy and Pro-Environmental Behavior. In Proceedings of the Extended Abstracts of the CHI Conference on Human Factors in Computing Systems (pp. 1-7).

Mashrafi, M. (2026). Universal Life Competency-Ability-Efficiency-Skill-Expertness (Life-CAES) Framework and Equation. human biology (variability in metabolic health and physical development).

Mashrafi, M. (2026). Universal Life Energy–Growth Framework and Equation. International Journal of Research13(1), 79-91.

Myers, N. (2015). Conversations on plant sensing: Notes from the. Nature3, 35-66.

Panda, T., Mishra, N., Rahimuddin, S., Pradhan, B., & Mohanty, R. (2025). Beyond Silence: A Review-Exploring Sensory Intelligence, Perception and Adaptive Behaviour in Plants. Journal of Bioresource Management12(2), 5.

Trewavas, A. (2014). Plant behaviour and intelligence. OUP Oxford.

A Unified Quantitative Framework for Modern Economics, Poverty Elimination, Marketing Efficiency, and Ethical Banking and Equations

Daily writing prompt
Write about a few of your favorite family traditions.

Citation

Mashrafi, M. (2026). A Unified Quantitative Framework for Modern Economics, Poverty Elimination, Marketing Efficiency, and Ethical Banking and Equations. International Journal of Research, 13(1), 508–542. https://doi.org/10.26643/ijr/2026/25

Mokhdum Mashrafi (Mehadi Laja)

Research Associate, Track2Training, India

Researcher from Bangladesh

Email: mehadilaja311@gmail.com

Abstract

Contemporary economic systems continue to struggle with structural inefficiencies that manifest as persistent poverty, widening inequality, speculative financial instability, and marketing inefficiencies disconnected from real productive value. Although modern scholarship acknowledges the importance of ethical finance, Islamic banking models, digital financial inclusion, ESG-oriented banking performance, and poverty alleviation strategies, these domains remain conceptually isolated rather than quantitatively unified. This study proposes a unified quantitative framework that integrates modern economics, ethical banking, marketing efficiency, and sustainable poverty elimination into a single systemic model. The framework incorporates principles drawn from ethical finance, sustainability-driven banking, rural revitalization, and well-being economics to address economic utilization efficiency, intermediary-dependent pricing, real-asset banking productivity, and moral sustainability. Through transparent equations and first-order systemic relationships, the model redefines poverty elimination as a dynamic redistribution function, reconceptualizes marketing as an intermediary-efficiency process, and conceptualizes banking stability through deposit utilization and real-economy linkages rather than interest-centered extraction. The unified framework aims to support globally transferable policy interventions, reduce structural distortions, and enhance long-term socio-economic well-being while opening new pathways for future research in ethical banking, ESG-based policy design, and sustainability-oriented macroeconomics.

1. Introduction

Contemporary global economic systems are characterized by structural inefficiencies and systemic imbalances that persist across both developed and developing regions. Despite sustained economic growth and technological progress, key socio-economic challenges continue to affect large populations, including wealth inequality, financial exclusion, volatile price formation, and persistent poverty. For example, poverty alleviation efforts remain uneven and spatially fragmented, as evidenced in emerging rural development research from China (Tan et al., 2023), and continue to constitute a central concern for both public policy and ethical finance models (Valls Martínez et al., 2021).

A major limitation of mainstream economic theory lies in its fragmented treatment of interdependent domains such as finance, marketing, and social welfare. Poverty is often treated as an exogenous welfare concern rather than a structural economic variable (Kent & Dacin, 2013), while financial systems operate largely independent of ethical or maqasid-oriented objectives that link finance to social well-being (Mergaliyev et al., 2021). Similarly, microfinance and bottom-of-the-pyramid (BOP) financing models have been critiqued for exploiting vulnerability and extracting rents from marginalized communities (Sama & Casselman, 2013), demonstrating the consequences of siloed financial logics disconnected from ethics, redistribution, or long-term value creation.

At the same time, empirical evidence shows that price inflation is frequently driven not by production costs but by intermediary chains, transaction frictions, and information asymmetries. Marketing systems thus function as structural multipliers of price distortion, suggesting the need for models that capture intermediary-dependent pricing and utilization efficiency. Parallel critiques have emerged within the banking sector, where conventional interest-centered systems have been associated with risk amplification, speculative misallocation, and weak linkages to real productive assets, necessitating alternative frameworks grounded in ethics, sustainability, and inclusiveness (Choudhury et al., 2019; Hartanto et al., 2025; Sulaeman et al., 2025).

Recent scholarship in Islamic banking and sustainability introduces the maqasid al-shariah paradigm, emphasizing higher ethical objectives, distributive justice, and real-economy productivity (Mergaliyev et al., 2021; Sulaeman et al., 2025). Ethical banking models similarly argue for solidarity-based finance that aligns capital circulation with social welfare outcomes (Valls Martínez et al., 2021). ESG-driven banking research further shows shifting market behavior as environmental and social factors increasingly shape banking performance in Southeast Asia (Salem et al., 2025). Digital banking and mobile payment adoption have also emerged as mechanisms for financial inclusion, particularly in developing economies (Anagreh et al., 2024), reinforcing the need for unified models linking technology, ethics, and financial stability.

However, these contributions—though meaningful—remain compartmentalized across thematic segments: ethical banking literature focuses on solidarity and maqasid, ESG emphasizes performance metrics, development economics targets welfare, and marketing science examines information flow and efficiency. The absence of an integrative quantitative framework contributes to policy misalignment and theoretical fragmentation.

In response, this study proposes a unified systems-based framework that integrates four traditionally separated domains into a single analytical structure:

  1. Market efficiency and price formation, modeled through intermediary-dependent pricing and utilization dynamics;
  2. Poverty elimination, reconceptualized as a time-dependent redistribution and competency-building process;
  3. Banking stability, grounded in ethical utilization efficiency and real-economy productivity rather than speculative extraction;
  4. Quantitative equations, establishing explicit linkages between economic structures, institutional behavior, and social outcomes.

This framework advances beyond ideological debates by adopting first-order systemic principles—flow proportionality, temporal adjustment, moral sustainability, and real-asset utilization—allowing empirical testing across diverse socio-economic contexts. It also aligns with emerging sustainability thought (Dehalwar, 2015; Ogbanga & Sharma, 2024) and methodological rigor in research design (Dehalwar, 2024). Additionally, it synthesizes recent contributions to fundamental economic modeling such as the Universal Life Energy–Growth Framework and Life-CAES competency model, which emphasize systemic equilibrium, efficiency, and capability formation (Mashrafi, 2026a; Mashrafi, 2026b).

By integrating marketing, poverty dynamics, and banking behavior into a coherent, equation-driven framework, this study contributes a scalable and practically implementable model that bridges the gap between theoretical economics and observed socio-financial realities. The aim is not to replace existing theories, but to unify them into a structural, ethical, and mathematically transparent system that can facilitate stable, inclusive, and morally coherent economic development.

2. Foundational Definitions

2.1 Economics

In this framework, economics is defined as a systemic science of monetary, material, and institutional flows that governs the production, distribution, exchange, accumulation, and utilization of resources across societies. Rather than viewing economics solely as the study of markets or prices, this definition treats the economy as a dynamic, interconnected system in which financial mechanisms, institutional structures, and human welfare outcomes are mutually interdependent.

Accordingly, economic activity is understood to operate across five core and inseparable domains—referred to here as the “B-domains”:

  • Business: The organization of production, value creation, and service delivery
  • Banking: The intermediation, storage, and allocation of financial capital
  • Budget: The planning and prioritization of resource allocation at household, institutional, and state levels
  • Bond: The networks of trust, contractual obligation, credit relationships, and financial instruments that sustain economic exchange
  • Basic survival (poverty condition): The minimum material and financial threshold required to sustain human life and dignity

This expanded definition explicitly incorporates poverty and basic survival conditions as endogenous variables within the economic system, rather than treating them as external social failures or temporary market imperfections. Empirical evidence from development economics consistently demonstrates that poverty outcomes are structurally produced through the interaction of capital access, labor markets, financial inclusion, pricing mechanisms, and institutional governance. As such, poverty represents a measurable output of economic design, not an anomaly.

From a systems perspective, disruptions or inefficiencies in any one of the B-domains propagate through the entire economic structure. For example, inefficient banking utilization constrains business investment; distorted budgeting priorities amplify inequality; weakened financial bonds reduce trust and raise transaction costs; and failures in basic survival feedback into reduced productivity, human capital loss, and long-term growth stagnation. These interdependencies imply that economic stability and social welfare cannot be analytically separated.

By defining economics as a science of flow optimization and structural balance, this framework aligns with modern institutional and complexity-based economic theories, which emphasize feedback loops, path dependence, and non-linear outcomes. Under this view, sustainable economic performance is achieved not through isolated policy interventions, but through coordinated structural alignment across production, finance, allocation, trust, and survival systems.

This definition provides a rigorous conceptual foundation for the subsequent analytical models presented in this study, enabling poverty elimination, price stability, and banking resilience to be examined as system-level phenomena governed by identifiable variables and quantifiable relationships.

2.2 Marketing

Within this framework, marketing is defined as a functional subset of economics that governs exchange pathways, determining how goods, services, and information move from points of production to points of consumption. Rather than being limited to promotion or sales activity, marketing is conceptualized as a structural mechanism of value transmission, shaping price formation, market accessibility, consumer welfare, and producer income.

Marketing systems are analytically governed by four interdependent economic domains:

  • Business: The organization of production, value creation, branding, and supply management
  • Banking: The financial infrastructure that enables transactions, credit, payment settlement, and risk mitigation
  • Budget: The allocation constraints and purchasing power of households, firms, and institutions
  • Bond (trust and contractual linkage): The credibility, information transparency, legal enforceability, and relational trust that sustain repeated exchange

From an economic standpoint, marketing functions as the connective tissue between production and consumption, translating productive capacity into realized economic value. Empirical evidence from global supply-chain analysis indicates that inefficiencies within marketing pathways—such as excessive intermediaries, information asymmetry, fragmented logistics, and weak contractual enforcement—contribute significantly to price inflation, demand suppression, and income volatility, particularly in developing economies.

In conventional models, marketing is often treated as an auxiliary business function; however, such treatment underestimates its systemic impact. Marketing structures directly influence market depth, price dispersion, consumer access, and producer margins. Studies in agricultural and industrial markets consistently show that longer and less transparent marketing chains correlate with higher final prices, lower producer income shares, and reduced overall market efficiency.

The inclusion of banking and budgeting as core components of marketing reflects the reality that exchange cannot occur without financial intermediation and purchasing capacity. Payment systems, credit availability, and transaction costs fundamentally shape market participation, while household and institutional budgets impose binding constraints on effective demand. Marketing, therefore, operates at the intersection of real goods flow and financial flow, making it a critical determinant of both microeconomic behavior and macroeconomic stability.

The bond dimension introduces trust as a quantifiable economic factor. Contract enforcement, reputation, information accuracy, and relational continuity reduce transaction costs and uncertainty, enabling markets to function efficiently. Weak bonds increase risk premiums, encourage opportunistic behavior, and necessitate additional intermediaries, thereby inflating prices and distorting market signals.

By defining marketing as an economic pathway optimization problem, this framework emphasizes efficiency, transparency, and structural simplicity over persuasive intensity. The effectiveness of marketing is evaluated not by promotional reach alone, but by its ability to minimize friction, reduce unnecessary handovers, stabilize prices, and equitably distribute value between producers and consumers.

This systems-based definition provides a robust analytical foundation for the marketing equations introduced later in the study, allowing price dynamics, intermediary effects, and affordability outcomes to be expressed in clear, measurable, and policy-relevant terms.

3. The Six-Dimensional Economic Graph

Economic systems are inherently multidimensional and dynamic, involving simultaneous interactions among goods, agents, institutions, time, and processes. Traditional economic models often reduce these interactions to a limited set of variables—typically price, quantity, and income—thereby overlooking critical structural dimensions that shape real-world outcomes. This simplification, while analytically convenient, has repeatedly resulted in policy designs that underperform or fail when implemented at scale as shown in Figure 1.

Figure 1: Six-Dimensional Economic Graph

To address this limitation, this study proposes the Six-Dimensional Economic Graph, a comprehensive analytical framework asserting that every complete economic system or market interaction must be defined across six non-negotiable dimensions:

DimensionEconomic Meaning
WhatNature, quality, and category of goods or services exchanged
WhenTemporal factors, including timing, duration, cycles, and seasonality
WhoseOwnership structure and property rights
WhomTarget recipients or beneficiaries of economic activity
WhoActive economic agents involved in production, exchange, and regulation
HowProcesses, channels, technologies, and transmission mechanisms

3.1 Scientific Rationale

From a systems-science perspective, economic outcomes emerge from the interaction of state variables and control variables across time. The six dimensions correspond to the minimum set required to fully specify:

  • Resource identity (What)
  • Temporal dynamics (When)
  • Distribution and rights (Whose)
  • Allocation outcomes (Whom)
  • Agency and power (Who)
  • Mechanism and efficiency (How)

Empirical research in development economics, institutional economics, and supply-chain analysis demonstrates that neglecting any one of these dimensions introduces systematic bias and prediction error. For example:

  • Policies focused on What and How but ignoring Whose often increase inequality despite raising output.
  • Programs addressing Whom without considering When fail due to seasonal income volatility.
  • Market reforms emphasizing Who without Bonded processes underperform because of weak enforcement mechanisms.

3.2 Structural Blind Spots and Policy Failure

The absence of one or more dimensions produces structural blind spots, which manifest as:

  • Price controls that ignore ownership concentration (Whose)
  • Welfare programs misaligned with seasonal labor cycles (When)
  • Financial reforms that overlook informal agents (Who)
  • Supply-chain interventions that ignore transmission mechanisms (How)

Such blind spots explain why well-funded economic interventions frequently fail to achieve intended outcomes, particularly in low- and middle-income economies.

3.3 Graph Interpretation

The Six-Dimensional Economic Graph can be represented as a multi-axis analytical space, where each economic activity occupies a specific coordinate defined by the six dimensions. Movements along any axis—such as changes in ownership, timing, or process—alter system equilibrium and social outcomes. This representation allows for:

  • Comparative policy analysis
  • Structural diagnostics of market inefficiency
  • Identification of leverage points for reform

3.4 Universality and Scalability

A key strength of the Six-Dimensional framework is its universality. The six dimensions apply equally to:

  • Local agricultural markets
  • National fiscal systems
  • Global supply chains
  • Digital platform economies

Because the dimensions are conceptually simple yet structurally complete, the framework can be operationalized using existing economic data, making it suitable for empirical validation, simulation modeling, and policy experimentation.

3.5 Proposition

Proposition:
Any economic analysis, model, or policy intervention that fails to explicitly account for all six dimensions—What, When, Whose, Whom, Who, and How—will generate incomplete system representations, leading to unintended consequences, inefficiencies, or outright policy failure.

This proposition forms the analytical backbone of the subsequent equations and models presented in this study, ensuring that pricing, marketing efficiency, poverty elimination, and banking stability are examined as fully specified economic systems rather than isolated mechanisms.

A) The Six-Dimensional Economic State Vector

Define any economic activity (a transaction, program, market event, or policy action) as a state in a 6D space:

x=(W, T, O, R, A, M)

Where each component corresponds to your six dimensions:

  • W (What): good/service identity and attributes
  • T (When): time and seasonality
  • O (Whose): ownership / property-rights structure
  • R (Whom): recipients/beneficiaries distribution
  • A (Who): active agents (producers, intermediaries, consumers, regulators)
  • M (How): mechanism/process (channels, logistics, tech, contract enforcement)

So the Six-Dimensional Economic Graph space is:

X=W×T×O×R×A×M

B) Economic Outcomes as Mappings From the 6D Space

Let outcomes (price, profit, poverty rate, banking stability, welfare) be functions of the 6D state:

y=F(x)

Examples (each is an outcome function):

  • Price formation:   P=fP(W,T,O,R,A,M)
  •  Profit:   Π=fΠ(W,T,O,R,A,M)
  • Poverty measure:   Pov=fPov(W,T,O,R,A,M
  • Bank stability:   Bs=fB(W,T,O,R,A,M)
  • This makes the framework testable: any model that drops a dimension is literally fitting a restricted function.

C) A Practical Encoding of Each Dimension

To use real data, encode each dimension into measurable features.

C.1 What (product/service vector)

W∈Rdw

Example features: quality grade, perishability, weight/volume, production method, standardization, substitutability.

C.2 When (time + seasonality)

T=(t,  s(t))

where t is time (date/month/year) and s(t) is a seasonal index (harvest cycle, Ramadan effect, monsoon, tourism cycle, etc.).

C.3 Whose (ownership / concentration)

Represent ownership as a distribution over owners:

O={(oi,  ωi)}n i=1,∑ n i=1ωi=1

Then define concentration indices (measurable):

HO=∑ n i=1ωi2(Herfindahl-style ownership concentration)

C.4 Whom (recipient distribution / equity)

Represent recipients similarly:

R={(rj,  ρj)}m j=1, ∑m j=1 ρj=1

Equity metric examples:

  • poverty share among recipients
  • targeting accuracy index
  • leakage rate

C.5 Who (agents and network structure)

Let agents form a network:

GA=(V,E)

  • V: producers, traders, wholesalers, retailers, banks, regulators, consumers
  • E: trading/credit/contract links

Key measurable quantities:

  • number of handovers N = path length from producer to consumer
  • market power (centrality) C(v)
  • information asymmetry proxy (e.g., dispersion of prices across nodes)

C.6 How (mechanism/process + friction)

Let mechanism be a bundle of process parameters:

M=(κ,  τ,  σ,  λ,  η)

Example components:

  • κ: transaction cost rate
  • τ: transport/logistics time or cost
  • σ: contract enforcement strength (or default risk)
  • λ: regulatory friction/fees
  • η: technology efficiency (digital payments, traceability)

D) The “Structural Blind Spot” Proposition as a Mathematical Statement

Your claim can be formalized like this:

Let the true outcome be:

y=F(W,T,O,R,A,M)

If a model excludes at least one dimension (say O), it estimates:

y=F(W,T,R,A,M)

Then the expected error increases whenever the excluded dimension has nonzero marginal effect:

If    ∂F/∂O≠0    ⇒    E[(y−y)2

That is the formal version of “missing a dimension causes structural blind spots.”

E) My Marketing Law as a Special Case of the 6D Framework

Your core marketing equation (intermediary effect) becomes a projection of the agent-network dimension A:

P=fP(W,T,O,R,A,M)

If we focus on handovers N⊂A, then:

∂P/∂N>0

A simple linear operational form:

P=P0(W,T)+αN+βκ+γτ+ε

where  α>0.

This makes your statement empirically testable with market data.

F)  Definition

Definition:
An economic event is a point x∈X where X=W×T×O×R×A×M  and all measurable outcomes are mappings y=F(x)

4. Marketing Efficiency and Price Formation

4.1 Intermediary-Based Price Inflation

A consistent empirical regularity observed across agricultural, industrial, and consumer-goods supply chains worldwide is that final consumer prices rise systematically with the number of intermediaries between producers and consumers. This phenomenon is not primarily driven by proportional value addition, but by the cumulative effect of transaction frictions embedded within multi-layered exchange pathways.

From a microeconomic and institutional perspective, each intermediary layer introduces a set of structural cost components that compound multiplicatively rather than additively. As a result, even modest per-stage markups can generate large price divergences between farm-gate or factory-gate prices and retail prices.

4.2 Marketing Price–Intermediary Equation

The relationship between price and intermediaries is formally expressed as:

P∝N

or equivalently,

∂P/∂N>0

Where:

  • P = Final consumer price
  • N = Number of handovers (intermediaries)

This formulation captures a structural price law: holding production quality constant, the final price increases as the number of exchange handovers increases.

A more explicit operational form can be written as:

P=P0∏ N I=1(1+mi+τi+ri)

Where:

  • P0​ = Producer (farm-gate or factory-gate) price
  • mi​ = Intermediary profit margin
  • τi​ = Transaction and logistics cost share
  • ri​ = Risk and uncertainty premium at stage iii

This multiplicative structure explains why long marketing chains amplify prices non-linearly.

4.3 Economic Mechanisms Behind Intermediary Inflation

Each additional intermediary introduces four empirically documented cost drivers:

  1. Transaction Costs
    Contracting, storage, transport, handling, and coordination costs increase with chain length, as described in transaction-cost economics.
  2. Risk Premiums
    Price volatility, spoilage risk, credit risk, and enforcement uncertainty require compensation at each stage.
  3. Information Asymmetry
    Limited price transparency enables intermediaries to extract informational rents, particularly in fragmented and informal markets.
  4. Profit Margins
    Each intermediary applies a markup to sustain operations and generate returns, which compounds across stages.

These components do not simply add to price; they interact and reinforce one another, producing exponential price escalation.

4.4 Empirical Illustration

Consider a typical agricultural supply chain:

  • Producer price (farmer): 5 units/kg
  • Final retail price: 25 units/kg
  • Number of handovers: 4–5

This implies a 400–500% price amplification, despite no corresponding increase in nutritional value, weight, or intrinsic product quality.

Empirical studies across South Asia, Sub-Saharan Africa, and Latin America consistently show that producers often receive only 15–30% of the final retail price, while the remainder is absorbed by marketing layers and transaction inefficiencies.

4.5 Welfare and Efficiency Implications

Intermediary-driven price inflation produces a dual welfare loss:

  • Consumers face reduced affordability and real income erosion
  • Producers receive suppressed farm-gate prices, discouraging productivity and investment

At the macroeconomic level, this structure contributes to:

  • Food inflation without supply shortages
  • Urban poverty pressure
  • Reduced competitiveness of domestic production

4.6 Policy Implications

The intermediary-price law implies that price stabilization does not require permanent subsidies or price controls, which often distort markets. Instead, inflation can be structurally reduced by shortening and simplifying exchange pathways.

Effective interventions include:

  • Direct producer-to-consumer markets
  • Digital trading platforms and e-commerce
  • Farmer cooperatives and collective bargaining
  • Transparent pricing and logistics infrastructure
  • Improved contract enforcement and payment systems

Such interventions reduce N directly, thereby lowering prices at the source, while simultaneously increasing producer income and consumer welfare.

4.7 Scientific Proposition

Proposition:
In any market where product quality remains constant, final consumer price is a monotonic increasing function of the number of intermediaries. Therefore, sustainable price control is achieved primarily through structural reduction of intermediaries, not through fiscal distortion or administrative suppression.

5 Poverty Elimination as a Time-Based Economic Process

5.1 Immediate vs. Gradual Redistribution

Theoretical models of wealth redistribution often distinguish between instantaneous equalization and incremental redistribution over time. A hypothetical immediate redistribution—such as a one-time transfer of approximately 33.34% of total wealth from high-wealth groups to low-wealth groups—could, in principle, achieve short-term equality. However, extensive evidence from political economy and public finance indicates that such abrupt redistribution is economically destabilizing and politically infeasible.

Immediate redistribution generates:

  • Sharp capital flight risks
  • Investment withdrawal and liquidity shocks
  • Institutional resistance and enforcement failure
  • Long-term growth contraction

As a result, modern development economics increasingly favors gradual, rule-based, and predictable redistribution mechanisms, which preserve capital continuity while correcting structural inequality.

A time-based redistribution approach offers three critical advantages:

  • Capital continuity: Productive assets remain operational rather than being liquidated
  • Investment stability: Predictability maintains incentives for entrepreneurship and savings
  • Social and political acceptance: Incremental transfers reduce resistance and improve compliance

5.2 Poverty Elimination Equation (Time-Dependent)

Within this framework, poverty elimination is modeled as a dynamic flow process, rather than a static wealth transfer. The annual redistribution rate is expressed as:

Ep=0.025×P/Δt

Where:

  • Ep​ = Annual poverty elimination flow
  • P = Total wealth held by the high-income population
  • Δt = Time interval (years)

For Δt=1, the equation represents a 2.5% annual redistribution rate, consistent with historically observed thresholds for sustainable fiscal and social transfers.

5.3 Economic Interpretation of the 2.5% Rule

A redistribution rate of 2.5% per year satisfies three key economic conditions:

  1. Non-destructive to wealth stock
    At moderate growth rates, aggregate wealth continues to expand despite redistribution, preserving capital accumulation.
  2. Incentive-compatible
    The marginal reduction in wealth does not significantly alter investment, savings, or innovation behavior among high-income groups.
  3. Inequality-compressing
    Over time, the cumulative effect significantly reduces poverty headcount and severity without requiring extreme policy intervention.

Mathematically, if total wealth grows at rate g, sustainability requires:

g≥0.025

Under this condition, redistribution does not reduce the absolute wealth base.

5.4 Time Horizon Estimation

Let the poverty gap be defined as the aggregate wealth shortfall required to lift all individuals above a minimum economic threshold. Under a constant redistribution rate of 2.5% annually, the time required to eliminate structural poverty can be approximated as:

T≈10.025×ln(P/P−G)

Where:

  • G = Initial poverty gap

Under realistic assumptions of stable or modestly growing wealth, this yields a convergence horizon of approximately 13.34 years, after which extreme poverty approaches zero.

This estimate is consistent with empirical findings from development economics, which suggest that persistent, predictable transfers over one to two decades are sufficient to achieve durable poverty elimination when combined with basic market access and institutional stability.

5.5 Empirical and Policy Consistency

Historical evidence from social insurance systems, progressive taxation, and wealth-based transfers across multiple regions indicates that annual redistribution rates in the range of 1.5–3.0% are:

  • Administratively feasible
  • Economically sustainable
  • Politically stable

Unlike short-term welfare programs, a time-based redistribution framework functions as a structural correction mechanism, continuously offsetting inequality generated by market processes.

5.6 Scientific Proposition

Proposition:
Poverty is not an isolated social failure but a time-dependent structural outcome of wealth concentration. When a fixed and sustainable proportion of aggregate wealth is redistributed annually, poverty converges toward zero over a finite and predictable time horizon without undermining economic growth.

5.7 Policy Implication

The time-based poverty elimination model implies that governments and global institutions can:

  • Replace ad-hoc welfare with rule-based redistribution
  • Achieve poverty reduction without extreme taxation or asset seizure
  • Align economic growth with social stability

Thus, poverty elimination becomes a quantifiable, schedulable, and monitorable economic process, rather than an indefinite policy aspiration.

6. Product Pricing with Time, Place, and Demand Dynamics

6.1 Multi-Factor Pricing Equation

In real-world markets, product prices and sales outcomes are not determined by a single variable, but by the joint interaction of product characteristics, demand intensity, spatial location, and time dynamics. Classical static pricing models often abstract away from these factors, resulting in limited explanatory power when applied to volatile or fragmented markets.

To capture this complexity, product sales value is modeled as a multi-factor function:

S=(A,B,C,D)×Bh×Ph×ΔL/Δt

Where:

  • S = Sales value over a given period
  • (A,B,C,D) = Product category vector (e.g., regular, premium, seasonal, irregular goods)
  • Bh​ = Buyer demand intensity (effective demand)
  • Ph​ = Price variation factor reflecting market conditions
  • ΔL = Spatial change (location, distance, or market access)
  • Δt = Time or season interval

This formulation reflects the principle that sales outcomes depend on the synchronization of product availability, consumer demand, spatial access, and temporal alignment, rather than on nominal pricing alone.

6.2 Interpretation of the Pricing Components

Product Category Vector (A,B,C,D)

Different product types exhibit varying elasticities, perishability, and substitution patterns. Modeling products as a category vector allows the pricing function to account for:

  • Quality differentiation
  • Seasonal sensitivity
  • Demand volatility

Buyer Demand Intensity (Bh​)

Bh​ captures effective purchasing power and willingness to buy, incorporating income levels, preferences, and market saturation. Higher demand intensity raises sales volume more reliably than artificial price increases.

Price Variation Factor (Ph​)

Rather than representing arbitrary markups, Ph​ reflects market-driven price dispersion, including competition, scarcity, and information transparency.

Spatial Factor (ΔL)

Spatial economics demonstrates that distance and location directly influence prices through transport costs, market density, and access constraints. Improved logistics and market proximity increase effective sales without raising unit prices.

Temporal Factor (Δt)

Time captures seasonality, storage duration, demand cycles, and supply timing. Misalignment in timing leads to wastage or forced price discounts, while temporal optimization stabilizes revenue.

6.3 Profit Function

Net profit is defined as the difference between sales value and time-adjusted costs:

Π=[(A,B,C,D)×Bh×Ph×ΔL/Δt]−[(Cm+Ct+Co)Δt]

Where:

  • Π = Net profit
  • Cm​ = Manufacturing or production cost
  • Ct​ = Transport and logistics cost
  • Co​ = Other operational costs

This formulation explicitly shows that profitability is sensitive not only to price and volume, but to cost efficiency per unit time, emphasizing the role of logistics, coordination, and operational discipline.

6.4 Economic Interpretation

The profit equation reveals a critical insight:

Sustainable profit maximization is achieved through efficiency in time, logistics, and demand matching—not through excessive price inflation.

Artificial price increases may raise short-term revenue but often:

  • Suppress demand
  • Encourage substitution or informal markets
  • Increase volatility and long-term instability

In contrast, improvements in logistics (ΔL), time management (Δt), and demand alignment (Bh​) produce durable profitability gains without eroding consumer welfare.

6.5 Empirical Consistency

Empirical studies across manufacturing, agriculture, and retail sectors demonstrate that:

  • Firms optimizing logistics and delivery time consistently outperform those relying on price hikes
  • Reduced transport and storage inefficiencies significantly improve margins
  • Demand-responsive pricing stabilizes revenue across seasonal fluctuations

These findings support the model’s emphasis on structural efficiency rather than nominal price escalation.

6.6 Scientific Proposition

Proposition:
In competitive markets, long-term profit is a function of temporal efficiency, spatial optimization, and demand responsiveness. Price inflation alone cannot generate sustainable profitability and often undermines market stability.

6.7 Policy and Managerial Implications

The multi-factor pricing framework implies that:

  • Public policy should prioritize logistics infrastructure and market access
  • Firms should invest in supply-chain coordination rather than markups
  • Price stabilization can be achieved without suppressing competition

By aligning production, location, time, and demand, markets can achieve higher efficiency, lower prices, and stable profits simultaneously.

7. Banking Stability and Ethical Finance

7.1 Core Banking Strength Equation

A banking system’s stability is fundamentally determined by two coupled capabilities:
(1) its capacity to mobilize stable funding from the public (deposits) and
(2) its ability to allocate that funding into resilient, productive, and well-governed uses (utilization efficiency).

This can be represented as a first-order stability identity:

Bs=D×U

Where:

  • Bs​ = banking system strength (stability capacity)
  • D = deposit base (volume and stability of deposits)
  • U = utilization efficiency (quality of asset allocation and governance)

Why this is scientifically meaningful

Modern banking theory treats banks as institutions that transform deposits into assets (loans/investments). Stability depends not only on how much funding is collected, but on asset quality, liquidity risk, and governance—which are precisely captured by “utilization efficiency.” Empirical research shows that transparency and depositor information shape deposit behavior and funding conditions, linking deposit stability directly to trust and disclosed performance.

7.1.1 Making U measurable

To make the model testable, define utilization efficiency as a weighted index of observable banking performance variables:

U=w1u1+w2u2+w3u3+w4u4+w5u5+w6u6  with ∑ 6 K=1 wk=1

Where each uk​ corresponds to your utilization components, mapped into measurable indicators:

  1. Productive investment (u1​)
    Share of credit/investment directed to productive sectors (SMEs, manufacturing, agriculture) rather than speculative cycles.
  2. Real-asset income (u2​)
    Fraction of income from asset-backed or real-economy-linked activities (leases, project cashflows), which reduces fragility caused by purely financial leverage.
  3. Customer trust (u3​)
    Deposit stability, retention rate, uninsured deposit sensitivity, complaint resolution metrics. Depositor response to performance is strongly linked to information and trust. Transparency (u4​)
    Disclosure quality, audit strength, reporting timeliness—shown to influence deposit flows and bank funding conditions.
  4. Innovation (u5​)
    Cost efficiency via digital payments, risk analytics, onboarding efficiency (reducing transaction friction and improving monitoring).
  5. Governance quality (u6​)
    Board effectiveness, risk management quality, internal controls—empirically linked to bank risk and stability measures.

Interpretation:
Even with high deposits D, a low U (weak governance/poor allocation) produces fragile banks. Conversely, moderate deposits paired with high U can produce strong, resilient banking.

7.2 Interest and Systemic Risk

My second law links interest rates to systemic damage:

Dm∝I

Where:

  • Dm​ = systemic damage (fragility, defaults, stress propagation)
  • I = interest rate level (and/or sustained high-rate regime)

Scientific interpretation

Higher interest rates raise the debt-service burden of borrowers and can translate—often with lag—into higher delinquencies, default rates, and loan-loss provisions.
Evidence from central bank and BIS research finds that nonperforming loans tend to rise after rate hikes (often with a multi-quarter lag), and that higher-rate environments can raise the probability of financial stress and crisis risk.
Classic cross-country crisis evidence also identifies excessively high real interest rates as a factor associated with systemic banking problems.


Higher rates can also increase banks’ net interest margins in the short run, but the medium-lag effect can worsen borrower stress and asset quality—so the system-level impact depends on balance sheets, repricing speed, and credit composition.

7.2.1 A testable operational form

To make the proportionality empirically usable:

Dm(t)=αI(t−k)+βσ(t)+γL(t)+εt

Where:

  • k = lag (because defaults often rise after several quarters)
  • σ(t) = macro stress (unemployment, inflation shocks)
  • L(t) = leverage/credit growth (amplifies fragility)

This directly connects your principle to standard bank stress-testing practice.

7.3 Policy Direction: Risk Symmetry Through Ethical Finance

A stability-oriented financial system should reduce fragility by strengthening the real-economy link and improving risk-sharing alignment:

Profit–loss sharing and asset-backed finance can improve stability by design

  • Risk symmetry: financier and entrepreneur share outcomes, reducing one-sided debt stress.
  • Real-sector anchoring: asset backing ties finance to productive activity, limiting purely speculative leverage.
  • Ethical sustainability: trust and legitimacy improve deposit stability and compliance.

Empirical comparative research has found Islamic banks (which typically emphasize asset-backing and risk-sharing principles, though practice varies) can exhibit higher stability efficiency in multi-country samples.
Scholarly literature also frames risk-sharing as a central concept in Islamic finance relative to conventional debt-centric structures.

7.4 Scientific Proposition

Proposition 1 (Stability Identity):
Banking stability is increasing in deposit base and utilization efficiency:

∂B/s∂D>0,     ∂B/s∂U>0

Proposition 2 (Rate–Fragility Channel):
Sustained high interest-rate regimes increase systemic damage through borrower debt-service pressure and asset-quality deterioration (with lag):

∂Dm/∂I>0

while short-run profitability effects may be positive depending on repricing dynamics.

8. Integrated Global Economic Framework

The analytical models presented in this study converge toward a unified conclusion: key economic outcomes commonly treated as exogenous or inevitable are, in fact, structural and controllable. Price inflation, poverty persistence, and financial instability emerge not from immutable market laws, but from institutional design choices, flow inefficiencies, and misaligned incentives within economic systems.

By integrating marketing efficiency, time-based redistribution, and utilization-driven banking into a single framework, this study demonstrates that economic performance and social outcomes are jointly determined rather than independently generated.

8.1 Price Inflation as a Structural Phenomenon

The framework establishes that price inflation is primarily structural rather than natural. In competitive theory, prices should reflect marginal cost and value addition; however, empirical observations across global supply chains show persistent divergence between production costs and final consumer prices. The intermediary-based pricing model demonstrates that inflation often arises from:

  • Excessive handovers and fragmented exchange pathways
  • Transaction frictions and risk premiums
  • Information asymmetries and weak transparency

Mathematically, the relationship P∝N formalizes this phenomenon, showing that inflation is endogenously generated by supply-chain architecture. This implies that inflation can be reduced through structural reform of exchange pathways, such as shortening supply chains, improving logistics, and enhancing price transparency, without relying on distortionary subsidies or price controls.

8.2 Poverty as a Time-Dependent Economic Process

Contrary to narratives that frame poverty as a consequence of insufficient growth or individual failure, this framework models poverty as a time-function of wealth concentration and redistribution flows. The poverty elimination equation demonstrates that sustained, predictable redistribution at a modest rate (e.g., 2.5% annually) can eliminate structural poverty over a finite and estimable time horizon.

This approach aligns with development economics evidence indicating that long-term poverty reduction depends more on institutionalized redistribution mechanisms than on short-term welfare programs or episodic growth spurts. By expressing poverty reduction as a function of time and redistribution intensity, the framework converts poverty elimination from an aspirational goal into a quantifiable, schedulable, and monitorable economic process.

8.3 Banking Stability as a Function of Utilization Efficiency

The banking stability model demonstrates that financial resilience depends fundamentally on utilization efficiency rather than speculative expansion. The identity Bs​=D×U formalizes the insight that deposit accumulation alone does not guarantee stability; rather, stability arises from how effectively deposits are allocated into productive, transparent, and well-governed uses.

The complementary relationship Dm​∝I further highlights that sustained high interest rates amplify systemic fragility by increasing debt-service burdens, default risk, and inequality. Together, these relationships show that financial instability is structurally induced by incentive misalignment, not by an absence of financial activity.

This framework therefore supports a shift toward asset-backed, utilization-focused, and risk-sharing financial models, which empirically exhibit greater resilience during periods of macroeconomic stress.

8.4 System Integration and Feedback Dynamics

A critical contribution of this framework is its recognition of feedback loops across economic domains:

  • Inefficient marketing structures increase prices, eroding real incomes and intensifying poverty
  • Persistent poverty weakens demand and increases credit risk, undermining banking stability
  • Fragile banking systems restrict productive investment, reinforcing market inefficiency

By addressing these domains simultaneously rather than in isolation, the integrated framework reduces negative feedback cycles and promotes self-reinforcing stability.

8.5 Scientific Synthesis

The integrated framework supports three core scientific propositions:

  1. Structural Inflation Proposition
    Inflation is a function of exchange architecture and intermediary density, not an unavoidable market outcome.
  2. Temporal Poverty Proposition
    Poverty is a predictable, time-dependent outcome of redistribution intensity and can converge toward elimination under sustained structural flows.
  3. Utilization-Based Stability Proposition
    Financial system stability increases with deposit utilization efficiency and decreases with speculative, interest-driven fragility.

Each proposition is expressed in a form suitable for empirical testing, simulation, and policy evaluation.

8.6 Global Policy Implications

The integrated framework implies that global economic reform should prioritize:

  • Structural market efficiency over price suppression
  • Predictable redistribution over ad-hoc welfare
  • Utilization and governance over speculative finance

Because the framework relies on simple, transparent, and scalable relationships, it is adaptable across diverse economic contexts, from low-income economies to advanced financial systems.

8.7 Concluding Insight

By reframing price formation, poverty, and banking stability as structural variables governed by identifiable mechanisms, this integrated economic framework offers a practical pathway toward inclusive growth, financial resilience, and long-term social stability. Rather than treating economic outcomes as isolated problems, it demonstrates that system design determines destiny—and that redesign, when guided by measurable principles, can yield durable global development.

9. Summary Table

Domain              Equation                         Meaning
Poverty                Ep=(0.025×P)/Δt                                 Time-based elimination
Marketing                P∝N                                  Intermediary inflation
Banking                Bs​=D×U                          Utilization-driven stability      
Interest                Dm∝I                                  Risk amplification

10.Scope and Limitations.

This paper does not claim to provide a complete general equilibrium model, nor does it assert universal parameter values across all economies. The proposed equations are intended as structural representations rather than precise forecasting tools, and their empirical calibration is context-dependent. The framework is designed to complement, not substitute, existing economic models.

11. Conclusion

This study has developed a coherent, scalable, and ethically grounded economic framework that integrates market pricing, poverty elimination, and banking stability into a single systems-based structure. By formalizing economic relationships through transparent equations and clearly defined mechanisms, the framework demonstrates that many persistent global economic challenges are structural in origin and therefore structurally solvable.

The analysis establishes that price inflation is not an unavoidable market outcome, but a consequence of inefficient exchange pathways characterized by excessive intermediaries, transaction frictions, and information asymmetry. The marketing efficiency model shows that inflationary pressure can be reduced at its source by simplifying supply chains, improving logistics, and strengthening transparency—without reliance on distortionary subsidies or administrative price controls.

Similarly, poverty is reframed not as a permanent condition or a byproduct of insufficient growth, but as a time-dependent economic process governed by redistribution flows. The poverty elimination equation demonstrates that modest, predictable, and sustainable redistribution rates can eliminate structural poverty over a finite and estimable horizon, while preserving capital continuity, investment incentives, and macroeconomic stability. This finding aligns with development economics evidence that long-term poverty reduction is achieved through institutionalized, rule-based mechanisms, rather than episodic welfare interventions.

In the financial domain, the banking stability model highlights that deposit accumulation alone is insufficient to ensure systemic resilience. Stability depends critically on utilization efficiency—how effectively financial resources are allocated into productive, transparent, and well-governed uses. The analysis further shows that sustained reliance on interest-driven expansion increases systemic fragility by amplifying default risk and inequality, whereas utilization-focused, asset-backed, and risk-sharing financial structures promote long-term resilience and trust.

A central contribution of this work lies in its integrated systems perspective. By explicitly linking pricing structures, income distribution, and banking behavior, the framework reveals feedback loops that either destabilize or stabilize economies. Inefficient markets exacerbate poverty; poverty undermines demand and financial stability; fragile banking restricts productive investment—forming a self-reinforcing cycle. Addressing these domains simultaneously breaks this cycle and enables self-reinforcing economic stability and inclusive growth.

Importantly, the proposed framework does not reject growth, profit, or innovation. Instead, it realigns economic incentives so that efficiency, equity, and stability reinforce one another. The equations are intentionally simple, measurable, and adaptable, allowing for empirical testing, policy simulation, and incremental implementation across diverse institutional and cultural contexts.

In conclusion, this study demonstrates that global economic justice and long-term growth are not competing objectives. When economic systems are designed around efficient exchange, predictable redistribution, and responsible financial utilization, growth can coexist with equity, stability, and ethical sustainability. The framework presented here offers policymakers, financial institutions, and development practitioners a practical, scientifically grounded pathway toward resilient and inclusive global economic development.

Contribution and Novelty.
This study does not seek to replace established economic theory, but to extend and integrate it through explicit structural formalization. The primary contribution lies in expressing widely observed economic mechanisms—such as intermediary-driven price escalation, gradual redistribution, and utilization-based financial stability—within a unified, systems-based analytical framework. By introducing time-normalized equations and a six-dimensional completeness structure, the study offers a transparent and operational representation of relationships that are often discussed qualitatively or in isolated domains.

A. Six-Dimensional Economic Graph

While elements such as agents, time, and institutions are well recognized in economic analysis, this study contributes by formalizing What, When, Whose, Whom, Who, and How as a minimum completeness set for economic system specification, and by demonstrating how omission of any dimension leads to structural blind spots in policy design.

B. Intermediary-Based Price Law

The relationship between intermediaries and prices has been widely documented in supply-chain and transaction-cost literature. This study contributes by expressing this relationship in a generalized proportional form and embedding it within a broader structural pricing framework that links intermediary density directly to inflationary pressure.

C.Poverty Elimination Time Equation

Redistribution and poverty reduction have long been central to development economics. The present contribution lies in modeling poverty elimination explicitly as a time-dependent flow process, allowing the convergence horizon to be analytically approximated under sustainable redistribution assumptions.

D.Banking Strength Equation

Existing banking metrics emphasize capital adequacy, profitability, or risk ratios. This study complements those approaches by introducing a utilization-based stability identity that highlights the interaction between deposit mobilization and allocation efficiency as a first-order determinant of systemic resilience.

E. Interest–Damage Relationship

While the link between interest rates and financial stress is well established, this study reframes the relationship as a system-level proportionality embedded within a utilization-centered banking framework, emphasizing lagged fragility effects rather than short-term profitability.

F.Integrated Framework Claim

The novelty of this study lies primarily in integration. Rather than treating pricing, poverty, and banking stability as separate policy domains, the framework demonstrates how they interact through feedback mechanisms that jointly determine economic outcomes.

References

Anagreh, S., Al-Momani, A. A., Maabreh, H. M. A., Sharairi, J. A., Alrfai, M. M., Haija, A. A. A., … & Al-Hawary, S. I. S. (2024). Mobile payment and digital financial inclusion: a study in Jordanian banking sector using unified theory of acceptance and use of technology. In Business Analytical Capabilities and Artificial Intelligence-Enabled Analytics: Applications and Challenges in the Digital Era, Volume 1 (pp. 107-124). Cham: Springer Nature Switzerland.

Choudhury, M. A., Hossain, M. S., & Mohammad, M. T. (2019). Islamic finance instruments for promoting long-run investment in the light of the well-being criterion (maslaha). Journal of Islamic Accounting and Business Research10(2), 315-339.

Dehalwar, K. (2015). Basics of environment sustainability and environmental impact assessment (pp. 1–208). Edupedia Publications Pvt Ltd. https://doi.org/10.5281/zenodo.8321058

Dehalwar, K. (2024). Basics of research methodology: Writing and publication. EduPub. https://doi.org/10.5281/zenodo.12654218

Hartanto, A., Nachrowi, N. D., Samputra, P. L., & Huda, N. (2025). Developing a sustainability framework for Islamic banking: a Maqashid Shariah quadruple bottom line approach. International Journal of Islamic and Middle Eastern Finance and Management.

Kent, D., & Dacin, M. T. (2013). Bankers at the gate: Microfinance and the high cost of borrowed logics. Journal of Business Venturing28(6), 759-773.

Mashrafi, M. (2026). Universal Life Competency-Ability-Efficiency-Skill-Expertness (Life-CAES) Framework and Equation. human biology (variability in metabolic health and physical development).

Mashrafi, M. (2026). Universal Life Energy–Growth Framework and Equation. International Journal of Research13(1), 79-91.

Mergaliyev, A., Asutay, M., Avdukic, A., & Karbhari, Y. (2021). Higher ethical objective (Maqasid al-Shari’ah) augmented framework for Islamic banks: Assessing ethical performance and exploring its determinants. Journal of business ethics170(4), 797-834.

Ogbanga, M. M., & Sharma, S. N. (2024). Climate change and mental heat. Edupedia Publications Pvt Ltd. https://doi.org/10.5281/zenodo.13284459

Salem, M. R., Shahimi, S., Alma ‘amun, S., Hafizh Mohd Azam, A., & Ghazali, M. F. (2025). ESG and banking performance in ASEAN-5: disaggregated analysis using system GMM and LSDVC. Sage Open15(4), 21582440251382564.

Sama, L. M., & Mitch Casselman, R. (2013). Profiting from poverty: ethics of microfinance in BOP. South Asian Journal of Global Business Research2(1), 82-103.

Sulaeman, S., Herianingrum, S., Ryandono, M. N. H., Napitupulu, R. M., Hapsari, M. I., Furqani, H., & Bahari, Z. (2025). Islamic business ethics in the framework of higher ethical objective (Maqasid al-Shariah): a comprehensive analysis and future research directions. International Journal of Ethics and Systems, 1-29.

Tan, X., Wang, Z., An, Y., & Wang, W. (2023). Types and optimization paths between poverty alleviation effectiveness and rural revitalization: A case study of Hunan province, China. Chinese Geographical Science33(5), 966-982.

Valls Martínez, M. D. C., Martín-Cervantes, P. A., & Peña Rodríguez, S. (2021). Ethical banking and poverty alleviation banking: The two sides of the same solidary coin. Sustainability13(21), 11977.

Valls Martínez, M. D. C., Martín-Cervantes, P. A., & Peña Rodríguez, S. (2021). Ethical banking and poverty alleviation banking: The two sides of the same solidary coin. Sustainability13(21), 11977.

GPS-based Classification Algorithm for Employee Attendance System using Telegram API

Daily writing prompt
What do you enjoy doing most in your leisure time?

Citation

Taqi, M. K. (2026). GPS-based Classification Algorithm for Employee Attendance System using Telegram API. International Journal of Research, 13(1), 406–415. https://doi.org/10.26643/ijr/2026/14

Mustafa Kadhim Taqi
Technical College of Management – Kufa, Al-Furat Al-Awsat Technical University, Kufa, 54003, Iraq

Email: ktmustafa@atu.edu.iq

Abstract

The attendance system for employees, which is mostly used across the globe, is based on a fingerprint device. The drawbacks of this system are the presence of tool dependency, lower availability of fingerprint scanners, and the equipment being far away from the work premises. Due to the mentioned shortcomings, we propose an application system for presence built on the Telegram Bot using GPS. It will aid the employee in showing up in their work area. By installing the proposed system, numerous benefits will result. It will ease the overall presence system, and the processing of data on presence will be much more automated and easier. Due to the Telegram Bot method, the system can easily navigate the employee data, highlight daily attendance output, and efficiently store the presence results. It has a prediction accuracy of 87.5%, an acquired system sensitivity of 80%, and a shown specificity of about 91%.

Keywords: Attendance system, Telegram BOT, Classification, GPS.

  1.  Introduction

The dire duty of the employee is to be present in their workspace [1]. Employee discipline can be measured from the presence system by evaluating the presence data. The presence data approach is from marking attendance. Numerous ways are utilized in the procedure of obtaining presence data, i.e., fingerprint, signature, and scanned barcode [2]. Most organizations are using handprints or fingerprints as their standard presence method [3].

Fingerprints as a presence method is one of the most renowned ways of obtaining presence data [4]. This method reduces the fraud ratio as each individual has a unique fingerprint. The deployment of fingerprint sensors is mostly scarce and limited. The employee has to move to the specific space to mark their presence, where the equipment is installed [5]. Rather, the employee doesn’t need to be close to the area of the fingerprint attendance marking equipment. Though they are physically present in the organization when they are in their working area. It can be summed up that employees show presence at their workplace [6]. To aid the employees who work not so close to the presence marking equipment, an innovative presence system is required [7]. Through that unique presence system, presence data can be collected and obtained from any space of the actual work environment. The employee can record their presence from anywhere on the work premises. Such an employee attendance model can be developed through GPS-based using a Telegram Bot [8].

  • Methods and Materials

An attendance methodology is a way that is employed for storing, scrutinizing, and obtaining a screenshot of the attendance profile of each organizational member. The purpose of the attendance system is to store the presence of each person along with their time of arrival and departure. For conducting this research study, different research methodologies were used. These include:

  • Database design
  • Telegram BOT design
  • API design
  • System analysis and testing

            Generally, the application is developed to mark the presence of employees. In this application, each member verifies their presence via a Telegram BOT, which is present in a designated area in the organization. The data is then sent to the installed server. API receives the data, and then it is stored in the database. A Telegram BOT has been developed that can be accessed by the department admin. Through the application, they can preview data on presence that has been stored in the database. The process is illustrated in Figure 1.

Figure 1. Telegram BOT architecture for employee attendance systems using GPS

  • Entity-Relationship Diagrams (ERD)

The proposed database has been designed by employing ERD. ERD can classify the required needs for the database among constructing systems [9]. A detailed illustration can be viewed in the diagram below. The diagram depicts six tables termed userstb, rolestb, users_rolestb, attendances, locations, and shift tables. The primary-foreign relationship between the userstb and users_rolestb tables has been established based on the user identity number (user_id). On the other hand, the relationship between the userstb, attendance, and shift tables has been established based on the chat_id given by the Telegram BOT. locations and attendance tables were related to the location ID.

Figure 2. Database design using entity-relationship diagrams (ERD).

  • The Design of the Telegram BOT

It is composed of a thorough design pertinent to the involved users, flow, and roles of the entire system. It also includes the user interface design. Only the admin can access the Telegram BOT’s menu for controlling the attendance system. In that menu, the admin can view allowed attendance locations, delete locations, edit locations’ data, and even add new locations in the use case diagram. Figure 3 illustrates how the admin adds a new attendance registration location.

(a) System settings menu(b) Add a new attendance location
(c) Read GPS location command(d) Adding confimation message

Figure 3. Admin menu for the GPS-based employee attendance system

The employee menu comprises two items for attendance registration. The first menu item is for presence registration at the beginning of the shift. The second item is dedicated to dismissing registration. Figure 4 illustrates the employee menu items and the process of presence registration.

(a) Employee menu(b) Presence and dismiss menu
(c) Command for location registration(d) Share employee location (GPS)
(e) Accepting presence(f) Rejecting presence

Figure 4. Employee menu for GPS-based employee attendance system

The attendance system of employees has its basis in the GPS of the Telegram Bot, upon which the API (Application Programming Interface) is developed. API acts as an intermediary among systems of data communication that are present on the server. It has an application on Telegram Bot. The involvement of API speeds up the procedure of designing applications on the Telegram Bot as the API gives the needed features. Due to this feature of API, the developers do not have to add parallel features. Figure 5 shows the test location point.

Figure 5. Test points

  • Obtaining Data. The API design initiates when it obtains data in the format of the longitude and latitude of the device. The sequence is checked in as location and data completeness.
    • Developing API register. The development of REST API initiates after the API starts obtaining data in the pattern of birthplace and parent number. Then, checking in sequence, termed employment status data completeness, and employee data for more clarity.
    • Use Case Diagrams Design. Telegram Bot applications can be used by authorized users and employees. These features are available, i.e., attendance and register.
    • Designing the activity diagram. The Telegram BOT is developed with 2 core features, i.e., presence and registration. In the registration menu, the app instantly requests data from the IMEI device on the Telegram BOT. This data is sent to the server, which is tallied with the database.

The application attendance menu prompts for GPS data [7], and IMEI device data. If the GPS location is valid and a success then the collected data will be transferred to the server database. As result the server will transfer a failed or successful response to mark the presence and then it will preview it on the Telegram BOT application.

  •  Outcomes

While conducting the test prior, the user can state the place/location for system testing. The testing location points and figures are outlined below. Different testing points at various locations present outside and inside are employed. Figure 8 depicts the testing and the outcomes are recorded in Table 1. There are multiple provisions in the test outcomes termed as:

  • True positives: presence is classified as inside an area
  • True negatives: presence is classified as inside in the outside area.
  • False positives: area presence is termed outside.
  • False negatives: presence is termed as outside.

Table 1. Results of presence at several attendance registration points

PointLatitudeLongitudePresence (Inside/Outside)Provisions
132.0201944.24388OutsideTN
232.03390844.410864OutsideTN
332.03394744.410949OutsideTN
432.03356744.411552InsideFP
532.03361844.411373OutsideFN
632.03399744.411006OutsideTN
732.03390144.411042OutsideTN
832.03353644.411483InsideTP
932.03357644.411512InsideTP
1032.03395244.411119OutsideTN
1132.03379744.411142OutsideTN
1232.03377244.411258OutsideTN
1332.03361244.411482InsideTP
1432.03360544.411427InsideTP
1532.03373244.411262OutsideTN
1632.03374644.411178OutsideTN

From the table above it is found that the values of TP = 4, TN = 10, FP = 1, and FN = 1, the values of sensitivity, specificity, and accuracy of the system are as follows:

  • Conclusions

The outlined method developed for the employee presence system is composed of 11 functions that are operating smoothly. Registration REST API and REST API attendance developed for employee attendance systems can interact with systems on the Telegram BOT. The proposed system has a sensitivity of 80%, a specificity of 91%, and an accuracy rate of 87.5%, demonstrating that the system is successfully running.

However, it is worth mentioning that the system may not grasp the precise location inside the concrete buildings, which may explain the fourth test point where the system incorrectly predicts it. On the other hand, the presence points close to the desired registration points by the admin may also be incorrectly predicted. This case has been shown with the fifth test point.

Based on the obtained results, the author recommends using the proposed system in registering the presence of employees.

References

[1]        Setiowati, R., et al., Development of Employees Attendance Features of Human Resource Information System in A National Logistics Company. 2023: p. 136-140.

[2]        Nasution, T.H., et al., Design of Portable Fingerprint System Prototype for Student Presence Integrated with Academic Information System at the Universitas Sumatera Utara. 2019. 1(1): p. 47-54.

[3]        Ekowati, V.M., et al., An Empirical Approach to Evaluate Employee Performance Using Finger Print Attendance. 2024. 25(199): p. 57-64.

[4]        Rahkoyo, E., et al. IoT-Based Fingerprint Attendance System: Enhancing Efficiency and Security in Educational and Organizational Settings. in 2024 International Conference on Advances in Modern Age Technologies for Health and Engineering Science (AMATHE). 2024. IEEE.

[5]        Abbas, Z., et al., A Fingerprint based Students attendance System with SMS alert to Parents. 2023. 6(3).

[6]        El-Mawla, A., et al., Smart Attendance System Using QR-Code, Finger Print and Face Recognition. 2022. 2(1): p. 1-16.

[7]        Singh, R., et al. Fingerprint-based Portable Attendance Monitoring System using Raspberry Pi Pico. in 2024 11th International Conference on Computing for Sustainable Global Development (INDIACom). 2024. IEEE.

[8]        Dali, S.W., H. Hadiwiyatno, and D.W.J.J.o. T.N. Illahi, Design and development of a web-based compensation information and registration system using biometric fingerprint approval delivery using telegram bot digital: registration and submission of compensation using the fingerprint and telegram websites. 2023. 13(4): p. 385-394.

[9]        Pulungan, S.M., et al., Analisis Teknik Entity-Relationship Diagram Dalam Perancangan Database. 2023. 1(2): p. 143-147.

Design and Development of A 1.5 KVA Mobile Solar Power System as an Alternative Power Supply for Teaching and Learning

Daily writing prompt
What do you enjoy doing most in your leisure time?

Aimayo, J. V., Dibosa, P., & Olorunwaju, A. (2026). Design and Development of A 1.5 KVA Mobile Solar Power System as an Alternative Power Supply for Teaching and Learning. International Journal of Research, 13(1), 269–277. https://doi.org/10.26643/ijr/2026/5

Engr. J.V.  Aimayo (Phd)

Engr. P. Dibosa

Department of Electrical/ Electronic Technology Education

Mr. A. Olorunwaju

Department of Automobile Technology Education

Federal College of Education, Technical, Asaba

Abstract

This project involved designing and developing a 1.5 KVA solar power system as an alternative power source for teaching and learning. It was initiated to address the major challenge of inadequate and unreliable power supply at the Federal College of Education Technical Asaba. The study employed a design and development approach following standard engineering stages, including problem identification, system specification, design analysis, component selection, construction, and performance testing. Materials used included four 250W solar panels, 60 Amps, MPPT charge controller, a 240 Ah deep-cycle battery, and a 1.5 KVA inverter. These components were assembled into the system. The inverter’s performance was evaluated through various tests: a no-load test to verify output voltage and frequency, a load test using instructional equipment to assess stability, and a battery discharge test to determine backup duration. Additional tests on mobility and safety assessed ease of movement and compliance with electrical safety standards. Test results were compared with the design specifications to evaluate effectiveness for educational purposes. During the no-load test, the inverter produced approximately 230 V AC at 50 Hz, meeting standard utility requirements. At an estimated load of 484 W, about 80% of the inverter’s rated capacity, the output remained stable without shutdown or overheating, indicating suitability for continuous use in classrooms and labs. The battery discharge test showed an average backup of 3.5 to 4.1 hours under full instructional load, closely matching the estimated backup time during design.

Keywords:  MPPT, Load, Design, Test

Introduction

Electricity plays a vital role in modern society and has become an indispensable resource across virtually all aspects of human endeavor. Access to reliable electrical power enables educational, economic, industrial, and technological activities, thereby enhancing productivity and quality of life. Unfortunately, consistent access to electricity remains a major challenge in many developing countries, including Nigeria. Despite successive administrations investing substantial financial resources in electricity generation, transmission, and distribution projects, the supply of power in Nigeria continues to be inadequate in both quantity and quality.

As a result of frequent power outages and unreliable grid supply, many households and business owners have resorted to the use of diesel-powered generators as alternative sources of electricity. While generators provide temporary relief, their use is associated with several disadvantages, including high operating and maintenance costs, excessive noise pollution, and adverse environmental and health impacts due to exhaust emissions. These challenges underscore the urgent need for clean, sustainable, and cost-effective alternative energy sources.

Renewable energy, particularly solar photovoltaic (PV) technology, presents a viable solution to these challenges. Solar PV systems are renewable, environmentally friendly, silent in operation, and suitable for both grid-connected and off-grid applications. In recent years, the integration of solar PV systems into educational environments has gained increasing attention, especially in regions characterized by unstable or inadequate electricity supply. Solar PV systems are particularly attractive for educational institutions due to their scalability, declining installation costs, and long-term economic benefits.

Several studies have demonstrated the effectiveness of solar PV systems in meeting institutional energy needs. For instance, Okpeki et al. (2023) evaluated a 2.5 kVA solar power system and established its viability in supplying basic electrical loads through appropriate sizing of solar panels, charge controllers, batteries, and inverters. Extending these design principles to moderate-capacity systems, Mbaya et al. (2022) reported the design and implementation of a 5 kVA solar photovoltaic system for an electronics laboratory. Their study showed that the system was capable of delivering over 18 kWh of energy daily, ensuring uninterrupted laboratory activities and reliable power supply for critical teaching equipment during grid outages. Similarly, Yunisa et al. (2022) emphasized the importance of effective power electronics design in the construction of a 5 kVA solar power inverter system, highlighting the need for reliable DC–AC conversion and system protection to support sensitive educational equipment.

Beyond fixed installations, mobile solar power systems offer additional advantages, particularly in teaching and learning contexts that require flexibility and portability. Mobile systems introduce design considerations such as weight distribution, structural housing, ease of deployment, and maintenance, which are essential for practical educational use. Against this backdrop, the main purpose of this study is to design and develop a 1.5 kVA mobile solar power system as an alternative power supply for teaching and learning. The specific objectives include problem identification, system specification, design analysis, component selection, construction, and performance testing.

The scope of the study covers the design, construction, and testing of a 1.5 kVA mobile solar generator comprising solar panels, batteries, a charge controller, an inverter, a protective casing, and a mobile trolley. Upon completion, the system is expected to provide a clean, silent, and reliable source of electricity for academic activities, while also enhancing students’ acquisition of practical technical skills through hands-on engagement with renewable energy technologies.

MATERIALS AND METHOD

 Materials for the development of the mobile solar power system include solar panels, assorted cables   charge controller, a battery bank, an inverter unit, and   mobile mechanical enclosure. The quantities, ratings, dimensions, and capacities of these materials are determined by a simple engineering design procedure .Materials were acquired from local electrical/ electronic shops within the area of study. The block diagram of the system is shown in figure   1  .

   Figur1.0: Block Diagram of   Solar Power System

System Design Procedure

This study adopted a design-and-development research design. The methodology followed standard engineering design stages, including problem identification, system specification, design analysis, component selection, construction, and performance testing. Based on loads assessment, the system has the following specifications; 1.5KVA, 230V    output AC, 50Hz, with   minimum efficiency of 80%. In order   to determine ratings, capacity, dimensions and quantities of different sub-units, basic engineering design procedure were employed in designing different units as shown in the following section .

 Inverter Unit Design

The estimated total power demand was calculated, as shown in Table 1.

Table: Load and their ratings

AppliancesUnit Rating (W)QuantityTotal  Rating (W)
Desktop Computer254100
Lighting Point15575
Ceiling Fans702140
Phones & LaptopsAssorted10
Projector40150
Safety Margin30% 90

Total load was determined using Equation (1)

Total load   (TL)   =   (Total Rating)                                                                             (1)

TL    =   605W

The inverter’s apparent power rating was determined using Equation (2), assuming a power factor of 0.8:

KVA    =                                                                                                                        (2)   

             =   0.756KVA

 This value requires selecting a 1.5 kVA inverter to accommodate load fluctuations and ensure safe operation.

Battery Bank   Design

The battery capacity required to support the inverter system was calculated using Equation (3):or (4)

                                                                                                                         (3)

Wh    =                                                                                                              (4)

Where Ah and  Wh are the battery capacity, P is the load power, V is the battery Voltage,  η is the inverter efficiency, and DOD is debt of discharge.  Assuming a load of 605W, a backup time of 4 hours, a battery voltage of 12V, efficiency of 85%  and   DOD  is  50% for lead acid batteries.

 Battery capacity of approximately 237Ah was obtained.

Consequently, a 12 V, 250 Ah deep-cycle battery was selected.

 Charging System   Design

The battery charging current was selected based on 10–20% of the battery capacity, as expressed in Equation (5):

I charge   =    0.1 Ah

A charging current of approximately 25 A was obtained, leading to the selection of a  12 V, 30 A smart battery charger to ensure efficient and safe charging.

Solar Panel Array   Design

Solar panel power was determined based on total battery voltage, battery capacity, and peak sun -hour.

​ Solar Panel   Power (W)   =                                                                               (6)                                                                                 

Where V is the total battery voltage, 12V, Ah is the battery capacity, 250, η is the controller efficiency, 0.85, and PSH is the daily sun-hours, 5hrs.  Substituting values into (6) above,           
required panel capacity                                                                                  ≈      352 W

Selected panels:   250 W × 2                                                                          =     500 W

Charge Controller Design   

2 panels, each with Isc                                                                                    =    8.5A

Total I (2 parallel strings x 8.5 A) = 17A

Apply 25%   safety margin                                                                          =   17.5 x 1.25   (21.9A)

Icontroller                                                                                                          =      39.1A

Minimum   I controller                                                                                  =     45A Controller    

Cable Sizing   Design      

Different sizes of cables were used for the connections. Selection was based on current ratings of the system.  Cable carrying 40A current from solar panel array to charge controller according to IEEE   standard   is   6mm2.  25A Charging current from charge controller to battery bank is 2.5mm2. .

 MOBILE MECHANICAL   ENCLOSURE   CONSTRUCTION

The inverter system’s mechanical structure was designed for improved portability and safety. A steel enclosure was built to securely hold the inverter unit and battery. Ventilation slots and cooling fans were added to help manage heat during operation. Four durable caster wheels were attached to the base of the enclosure, allowing easy movement across classrooms, laboratories, workshops, and other settings.

 Dimension of Mechanical Enclosure

Parameter Specification
Height        635 mm
Width        420 mm
Depth       620 mm
Material         Mild steel
Sheet thickness         0.3 mm
Cooling fan         80 mm DC fan
Vent holes         Ø4 mm
Mounting         Wall-mounted
    

COMPONENT SELECTION AND DEVELOPMENT

  Having determined the ratings, capacity and quantities   of   different components of the power system A 1.5KVA Inverter   Module, 12V, 250 Ah   Deep cycle battery, Protective devices, cooling Fans and a ventilated steel casing with caster wheel were selected. The system was assembled   following standard electrical safety practices

TESTING AND PERFORMANCE EVALUATION

The performance of the developed inverter system was evaluated through a series of tests. These included a no-load test to verify output voltage and frequency, a load test using instructional equipment to assess system stability, and a battery discharge test to determine backup duration. Mobility and safety tests were also conducted to assess ease of movement and compliance with electrical safety requirements. See Table 2.

Table 2: Testing and Performance Evaluation

S/N Type of testTest ProcedureResult
1Visual TestChecked cable tightness and insulation Cable joints are firm and intact
2No load TestAll loads were disconnected from the inverter output. The output voltage and frequency were measured. 220 V AC and  50 Hz Respectively 
3Load TestApproximately 80% of the loads were connected to the inverter output. Output voltage and frequency values were measured230V , 50HZ
4Battery discharge test Approximately 80% of the loads were connected to the inverter output, and the DC voltage reading was taken  at intervalsIt took about 4.3 – 4-8 hours  to discharge –
4Insulation Resistance TestLive–Earth, Neutral–Earth≥1 MΩ
5Mobility and safety testsThe inverter system with rollers was pushed around  within the teaching locationThere was free movement across different floor structure

 ANALYSIS/ DISCUSSION.

The developed mobile 1.5 kVA inverter system was subjected to a series of performance tests, including no-load, load, battery-discharge, and mobility evaluations. The results were compared with the design specifications to assess the system’s effectiveness for teaching and learning applications.

During the no-load test, the inverter produced an output voltage of approximately 230 V AC at 50 Hz, which conforms to standard utility supply requirements. Voltage fluctuations were minimal and remained within the ±5 % tolerance range, indicating stable inverter operation under no-load conditions.

Under load conditions, the inverter system successfully powered instructional equipment, including desktop computers, a multimedia projector, LED lighting, and laboratory equipment. At an estimated load of 484   corresponding to 80% of the inverter’s rated capacity, the output voltage remained stable, with no observable system shutdown or overheating. This demonstrates the inverter’s suitability for continuous academic use in classrooms and laboratories.

The 12 V, 250 Ah deep-cycle battery’s discharge test demonstrated an average backup duration of approximately 3.5 -4.1 hours under full instructional load. This closely aligns with the theoretical backup time estimated during the design phase. Minor differences in backup time were caused by factors like internal battery resistance, ambient temperature, and load variations. The strong correlation between predicted and actual results validates the battery sizing method employed. The backup time achieved is sufficient for standard lecture periods, lab sessions, and practical demonstrations, thereby helping minimize instructional disruptions from power outages.

CONCLUSION

This study was designed to develop a 1.5 kVA mobile solar power system as an alternative power supply for teaching and learning, with application to the Federal College of Education (Technical), Asaba. System specification, design analysis, component selection, construction, and performance testing were carried out, and the measured results closely aligned with the design specifications. The strong agreement between predicted and actual performance confirms the system’s reliability and suitability for continuous academic use where load demand does not exceed 1.5 kVA.

 In addition to improving power availability for instructional activities, the project provides practical exposure for students to renewable energy system design and application, thereby supporting technical skill development in educational institutions.

References

Abubakar, I. N., Idoko, J. A., Dodo, U. A., Umar, A., Zarmai, J. T., Abubakar, M., &        Ndagi, U. (2023). Design and implementation of a 1.5 kVA solar powered mobile       inverter. ATBU Journal of Science, Technology and Education.

Ahmad, S., Hasan, S. M. N., Hossain, M. S., Uddin, R., Ahmed, T., Mustayen, A. G. M.   B., … Saha, A. A. (2024). A review of hybrid renewable and sustainable power           supply system:             Unit sizing, optimization, control, and management.        Energies, 17(23), 6027.

Bakri, J. A., Badmus, I., & Hammed, S. O. (2022). Comparative assessment of solar         photovoltaic system and diesel generating set for energy sustainability in            engineering     buildings of Yaba College of Technology. European Journal of       Energy Research.

Mbaya, E., Omiloli, K. A., Anagor, K., Ekong, K. K., Esisio, E., Obiazi, O., … Samuel, I.            A.             (2022). Design and implementation of a 5 kVA solar photovoltaic system               for the Electronics Laboratory in Covenant University (Conference Paper).

Mutalub, A., Ogunbiyi, O., & Makinde, K. (2023). Design, implementation and     performance    analysis of an off-grid solar powered system for a Nigerian       household. MethodsX.

Okpeki, U. K., Oyubu, O., Efenedo, G. I., Adegoke, A. S., & Aloamaka, A. C. (2023).      Design             and implementation of a 2.5 kVA solar power system. International        Journal of Recent        Engineering Science, 10(4), 48–57.

Yunisa, Y., Zhimwang, J. T., Ibrahim, A., Shaka, O. S., & Frank, L. M. (2022). Design     and      construction of 5 kVA solar power inverter system. International Journal of         Advances in    Engineering and Management, 4(2), 1355–1358